
Back to monitoring in Angie. An earlier article in this series set up a basic configuration that exports metrics to Prometheus and visualizes them in Grafana. This article puts Angie's custom metrics to work and turns the result into charts in Grafana.
Video version
A video version of this article is available on YouTube.
Custom metrics in Angie
Angie has strong monitoring capabilities out of the box, and it also lets you extend them without limits. The extension points are implemented by the standard Metric module, which the developers covered in a dedicated article. If you are not familiar with that module, it is worth a look. This time the goal is one very useful metric: upstream response time. The free version does not export it, even though it is genuinely useful. The task is to carry the metric through the whole monitoring stack, all the way to a chart in Grafana.
Custom metrics are configured from variables. Upstream response time already has a ready-made variable holding the needed value: $upstream_response_time.
Start with something simple: create a shared memory zone to store the metric in the http context, plus the metric itself to collect statistics per server address:
http {
  metric_zone upstream_time:1m expire=on average mean window=15s count=20;
  metric upstream_time $upstream_addr=$upstream_response_time on=end;
}
The zone is named upstream_time, 1 MB in size; on overflow, old values are dropped; the calculation is a mean over a 15-second window.
Once the zone is declared, declare the metric itself. The key is the server address ($upstream_addr); the value is the server response time ($upstream_response_time). This metric gives the average response time of each upstream server.
Some configurations need finer granularity. For example, when Angie serves several sites and the response time metric should be tracked separately for each of them. Add one more metric zone:
http {
  metric_zone site:1m expire=on average mean window=15s;
}
The zone parameters are nearly identical to the previous one. The metric itself, however, is declared at the location level inside each site (server block), for example:
upstream apache {
  zone apache 10m;
  server 127.0.0.1:9090;
}

server {
...
 location / {
    metric upstream_time $upstream_addr=$upstream_response_time on=end;
    metric site $server_name=$upstream_response_time on=end;
    proxy_pass         http://apache;
    }
}
Note that the server address is defined in the upstream block, which allows finer control over it and also improves how metrics render in the Grafana dashboard (the group name shows up next to the server address). The metric is declared at the location level that proxies the requests, and this time the metric key is the server name ($server_name). The shared metric (upstream_time) is also redeclared here so that metrics from this location are counted too.
Metric collection can be verified over the HTTP API. Assuming it is configured at URI /api/ and reachable on localhost, fetch the metric values with:
curl http://localhost/api/http/metric_zones/site/
curl http://localhost/api/http/metric_zones/upstream_time/
If the response contains JSON with the expected values, the configuration works. If the values are zero, send a few test requests to the server to refresh the metrics.
Metrics are being collected; the next step is exporting them to Prometheus.
Export to Prometheus
At this point, assume that basic metric export and Grafana visualization are already set up, as described in the earlier monitoring article in this series. If Grafana monitoring of Angie is not configured yet, complete the setup from that article first, then come back to this step.
Add the new metrics to the export config file prometheus_all.conf (in /etc/angie by default). Add these lines inside the prometheus_template all block:
'angie_http_upstreams_response_time{server_name="$1"}' $p8s_value
    path=~^/http/metric_zones/site/metrics/(.+?)$
    type=gauge
    'help=Upstream response time by server_name in HTTP.';

'angie_http_upstreams_response_time_stats{upstream_addr="$1"}'  $p8s_value
    path=~^/http/metric_zones/upstream_time/metrics/(.+?)$
    type=gauge
    'help=Upstream response time by upstream_addr in HTTP.';
The first directive describes the export of the site metric (upstream response time per site); the second exports the aggregate statistics by server address (upstream_time). The key is the value captured by the group in the regular expression ($1), the metric type is gauge, and the paths are set to match the metric names.
After reloading the server configuration, verify the export at the scrape endpoint (here http://localhost/p8s):
curl http://localhost/p8s

...
# HELP angie_http_upstreams_response_time Upstream response time by server_name in HTTP.
# TYPE angie_http_upstreams_response_time gauge
angie_http_upstreams_response_time{server_name="ttt.ru"} 0
angie_http_upstreams_response_time{server_name="ttt2.ru"} 0
# HELP angie_http_upstreams_response_time_stats Upstream response time by upstream_addr in HTTP.
# TYPE angie_http_upstreams_response_time_stats gauge
angie_http_upstreams_response_time_stats{upstream_addr="127.0.0.1:9090"} 0.1285
The metrics are exported and accumulating in Prometheus. All that is left is adding them to the dashboard.
Visualization in Grafana
The metrics will be displayed as graphs. To simplify the setup, start by cloning an existing panel from the dashboard.
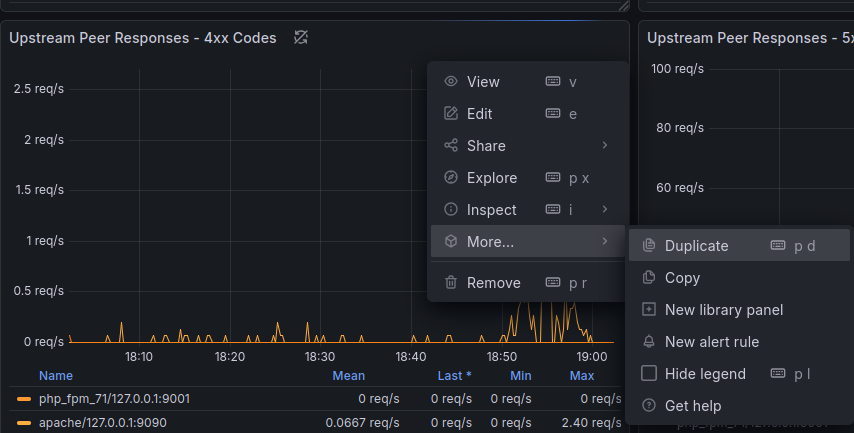
Open the Angie dashboard and enable edit mode (the Edit button in the top-right corner). Find a panel (for example Upstream Peer Responses — 4xx Codes) and in its menu (top-right corner of the panel) choose More.. → Duplicate.
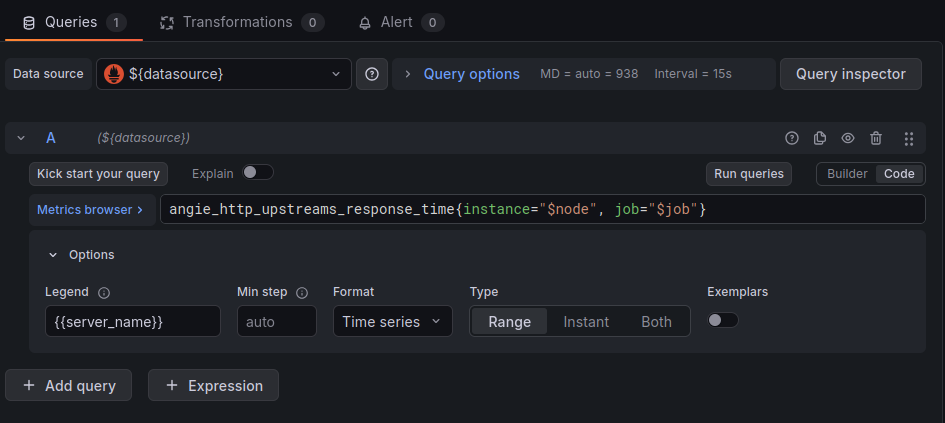
Next, open the duplicated panel for editing (Edit) and rename it to Upstream Response Time. In the bottom panel (Queries), replace the metric query with:
angie_http_upstreams_response_time{instance="$node", job="$job"}
In the Legend field (Options panel), set {{server_name}}. This produces a response-time graph per site. The result should look like this:
Optionally, fine-tune the panel in the right-hand Visualization panel: line appearance and the color palette. Also set the unit of measurement in the Unit field to seconds. Save the dashboard with the Save Dashboard button at the top right.
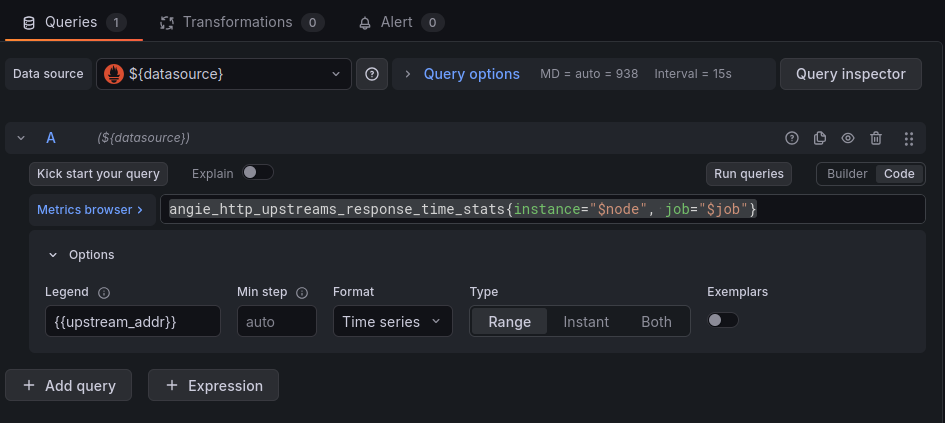
Repeat the same steps for the response time metric per server address; only the query and the Legend field differ. The query should be:
angie_http_upstreams_response_time_stats{instance=“$node”, job=“$job”}
Legend field: {{upstream_addr}}. The result:
Check the settings in the Visualization panel again and save the dashboard.
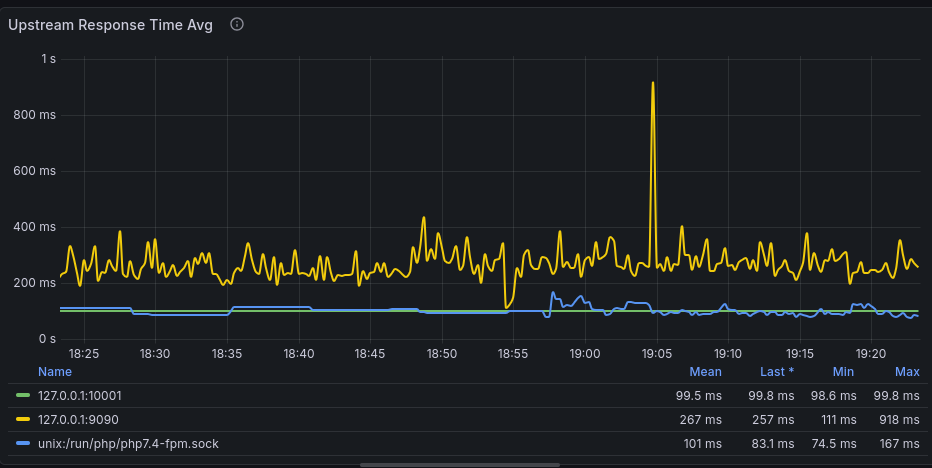
If everything went well, the dashboard now shows graphs like these:
That completes the setup. After making changes, back up the dashboard code so the new panels are not lost. On the dashboard page, top right: Export -> Export as code.
Summary
Angie's custom metrics module provides unlimited options for building a monitoring system. This article walked through the full metric lifecycle: from declaring a zone to visualizing it in Grafana. The community will surely benefit from sharing metric configurations that enrich the Angie dashboard. The same system can monitor not only the web server or load balancer but also other application components — for example, by passing metrics from the backend in HTTP headers.