
Nginx's built-in monitoring capabilities are fairly limited. The problem has been solved in different ways: either by parsing logs or with third-party modules. When Angie was created, the problem was addressed head-on and in several ways at once. Let's start with the historic stub_status module.
Video version
A video version of this article is available on YouTube.
Monitoring with the stub_status module
For a long time, stub_status was the only standard module for monitoring Nginx. Setting it up is quite simple — you only need to allocate a location for serving the statistics (it is also advisable to close it off from external access).
location = /angie-status {
    auth_basic "Identify yourself!";
    auth_basic_user_file /etc/angie/passwd;
    allow 127.0.0.0/24;
    stub_status;
}
Let's see what can be learned from stub_status:
curl localhost/angie-status
...
Active connections: 2
server accepts handled requests
 114809 114809 346721
Reading: 0 Writing: 1 Waiting: 1
This is mostly statistics on connection states: active (Active), receiving (Reading) and sending (Writing) data, and idle (Waiting). There is also the count of accepted (accepts) and handled connections, along with the total number of requests (requests).
That is where the module's capabilities end. For Nginx, the remaining options are CPU-hungry log parsing (Nginx Amplify style) or building third-party modules (such as VTS and STS). Angie, however, ships a dedicated API module that collects and serves statistics for dozens of internal metrics without adding extra load on the CPU. These metrics are stored efficiently in shared-memory zones and are updated in real time by the server itself.
The API module and its metrics
Angie's monitoring is built on the API module — it is what collects and presents metrics for monitoring. Besides monitoring tasks, the API module can provide information about the server configuration, and in Angie PRO it can also manage that configuration.
At the time of writing, the module supports the following object types:
- overall server status (/server/angie);
- connection statistics (/status/connections);
- DNS resolver statistics (/status/resolvers/
); - shared-memory zones (/status/slabs/
); - HTTP server zones (/status/http/server_zones/
); - HTTP location zones (/status/http/location_zones/
); - Stream zones for TCP/UDP servers (/status/stream/server_zones/
); - response caching zones (/status/http/caches/
); - HTTP zones for connection limiting (/status/http/limit_conns/
); - Stream zones for connection limiting (/status/stream/limit_conns/
); - HTTP zones for request limiting (/status/http/limit_reqs/
); - HTTP server groups (/status/http/upstreams/
); - TCP/UDP server groups (/status/stream/upstreams/
); - Angie PRO dynamic configuration API (/config/).
In metric addresses, the value in angle brackets holds the zone name, and how to set it is discussed in the next section of this article.
Enabling the module is quite simple — you need to define the location where you want to see the metrics and server configuration:
location /status/ {
    api /status/;
    api_config_files on;
    auth_basic "Identify yourself!";
    auth_basic_user_file /etc/angie/passwd;
    allow 127.0.0.0/24;
}
In this case, we can reach the metrics at the URI /status/. The api directive is responsible for enabling the REST interface of the API module, while api_config_files adds an object with the contents of the server's configuration files. The path in the api directive is optional, but it can be used to grant partial access to metrics (in the same way as the alias directive), for example only for the HTTP zones section (/http/server_zones/):
location /stats/ {
    api /status/http/server_zones/;
}
Metric values can be obtained with an HTTP request naming the section you need (let's look at the HTTP zone metrics):
curl http://localhost/status/http/server_zones

{
    "balance": {
        "requests": {
            "total": 16593,
            "processing": 1,
            "discarded": 0
        },

        "responses": {
            "200": 16586,
            "304": 4,
            "502": 2
        },

        "data": {
            "received": 5630052,
            "sent": 13705111
        }
    },

    "static_site": {
        "requests": {
            "total": 0,
            "processing": 0,
            "discarded": 0
        },

        "responses": {},
        "data": {
            "received": 0,
            "sent": 0
        }
    }
}
The output format for metrics is JSON; individual metrics are described in the documentation of the API module.
At this stage, a fair question may come up: does anything else need to be configured to get the full set of metrics across all sections? Yes, it does, and that is what we will talk about next.
Configuring zones for metric collection
Metrics are enabled differently for different object types. For example, if an HTTP cache is enabled (the proxy_cache_path directive is present), metrics will be collected automatically, and the metric zone name is defined by the cache zone name. The same applies to all limit zones of the limit_req and limit_conn modules. All shared-memory zones are also monitored by default.
Metric collection for server-level (server) and location objects is enabled with the status_zone directive:
server {
    listen 80 default_server;
    status_zone balance;
    server_name _;

    location / {
        status_zone location_root;
        proxy_pass  http://backend;
    }
}
The status_zone directive takes a single parameter — the zone name by which metric values can then be fetched. For example:
curl http://localhost/status/http/server_zones/balance

{
    "requests": {
        "total": 30461,
        "processing": 1,
        "discarded": 0
    },

    "responses": {
        "200": 30447,
        "304": 11,
        "502": 2
    },

    "data": {
        "received": 10383383,
        "sent": 24770338
    }
}

curl http://localhost/status/http/location_zones/location_root

{
    "requests": {
        "total": 1426,
        "discarded": 0
    },

    "responses": {
        "200": 1424,
        "502": 2
    },

    "data": {
        "received": 424322,
        "sent": 3907588
    }
}
To collect metrics for server groups (HTTP or stream), you should use the zone directive. This way we create a memory area shared between the worker processes, which will hold the state of the servers.
upstream backend {
    zone upstream-backend 10m;
    server 127.0.0.1:9000;
    server 127.0.0.1:9001;
}
As the example shows, the directive takes two parameters: the zone name and the size.
To monitor DNS resolvers, the status_zone parameter needs to be added to the resolver directive:
resolver 127.0.0.53 ipv6=off valid=30s status_zone=local;
Metric collection for the objects we care about is now configured. The statistics are available over the REST API, but that is not all — almost all metrics can be visualized with the Angie Console Light component.
Angie Console Light
For real-time operational monitoring of the system, a panel that visualizes the metrics provided by the API module comes in handy. That is what the Angie Console Light panel does — another component of the Angie web server.
As usual, we start by installing the package from the official repository:
sudo apt install angie-console-light
dnf install angie-console-light
For Angie PRO the package is called angie-pro-console-light. After installation, you need to pick a suitable server block and set up a location for the console. You then get access to the console through that server. The minimal configuration looks like this.
location /console/ {
     alias /usr/share/angie-console-light/html/;
    index index.html;

    location /console/api/ {
            api /status/;
        }
}
Angie PRO additionally supports managing the configuration of server groups; for this feature, add the following location.
location /console/api/config/ {
        api /config/;
}
Security, of course: we close off access to the console using directives of the Access, Auth Basic or other modules. For example, you can use the set of directives from the start of the article:
location /console/ {
    auth_basic "Identify yourself!";
    auth_basic_user_file /etc/angie/passwd;
    allow 127.0.0.0/24;
    ...
}
The panel is configured, and we can open the location /console/ we set up. The console's main page shows overall server statistics. All top-level blocks for which we enabled monitoring are visible as well.
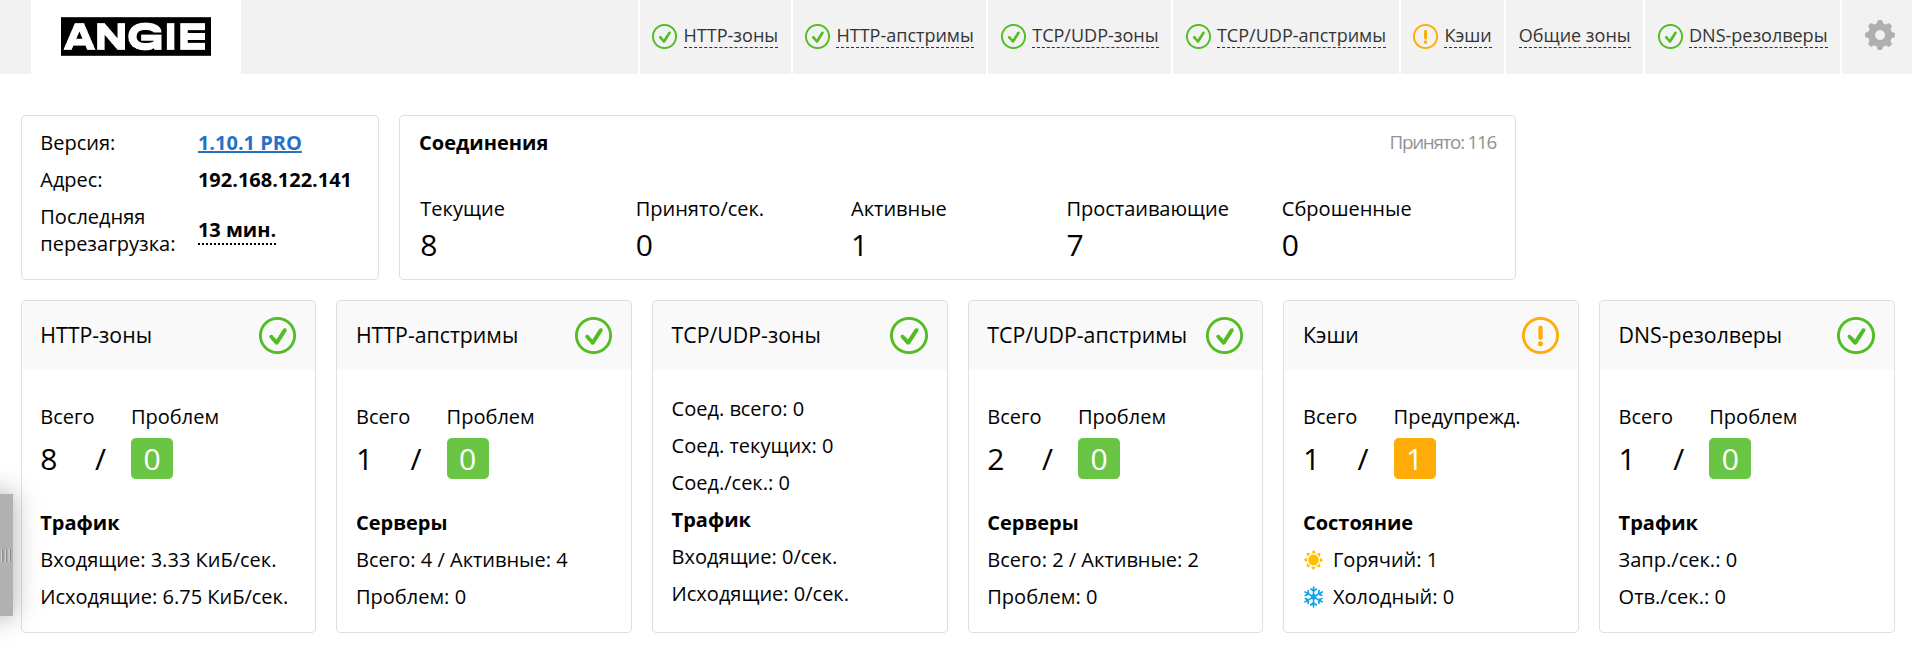
A full description of the metrics and interface elements is in the documentation, so here is a quick run-through of the pages available today. The "HTTP zones" page has the server zones and the zones for location.
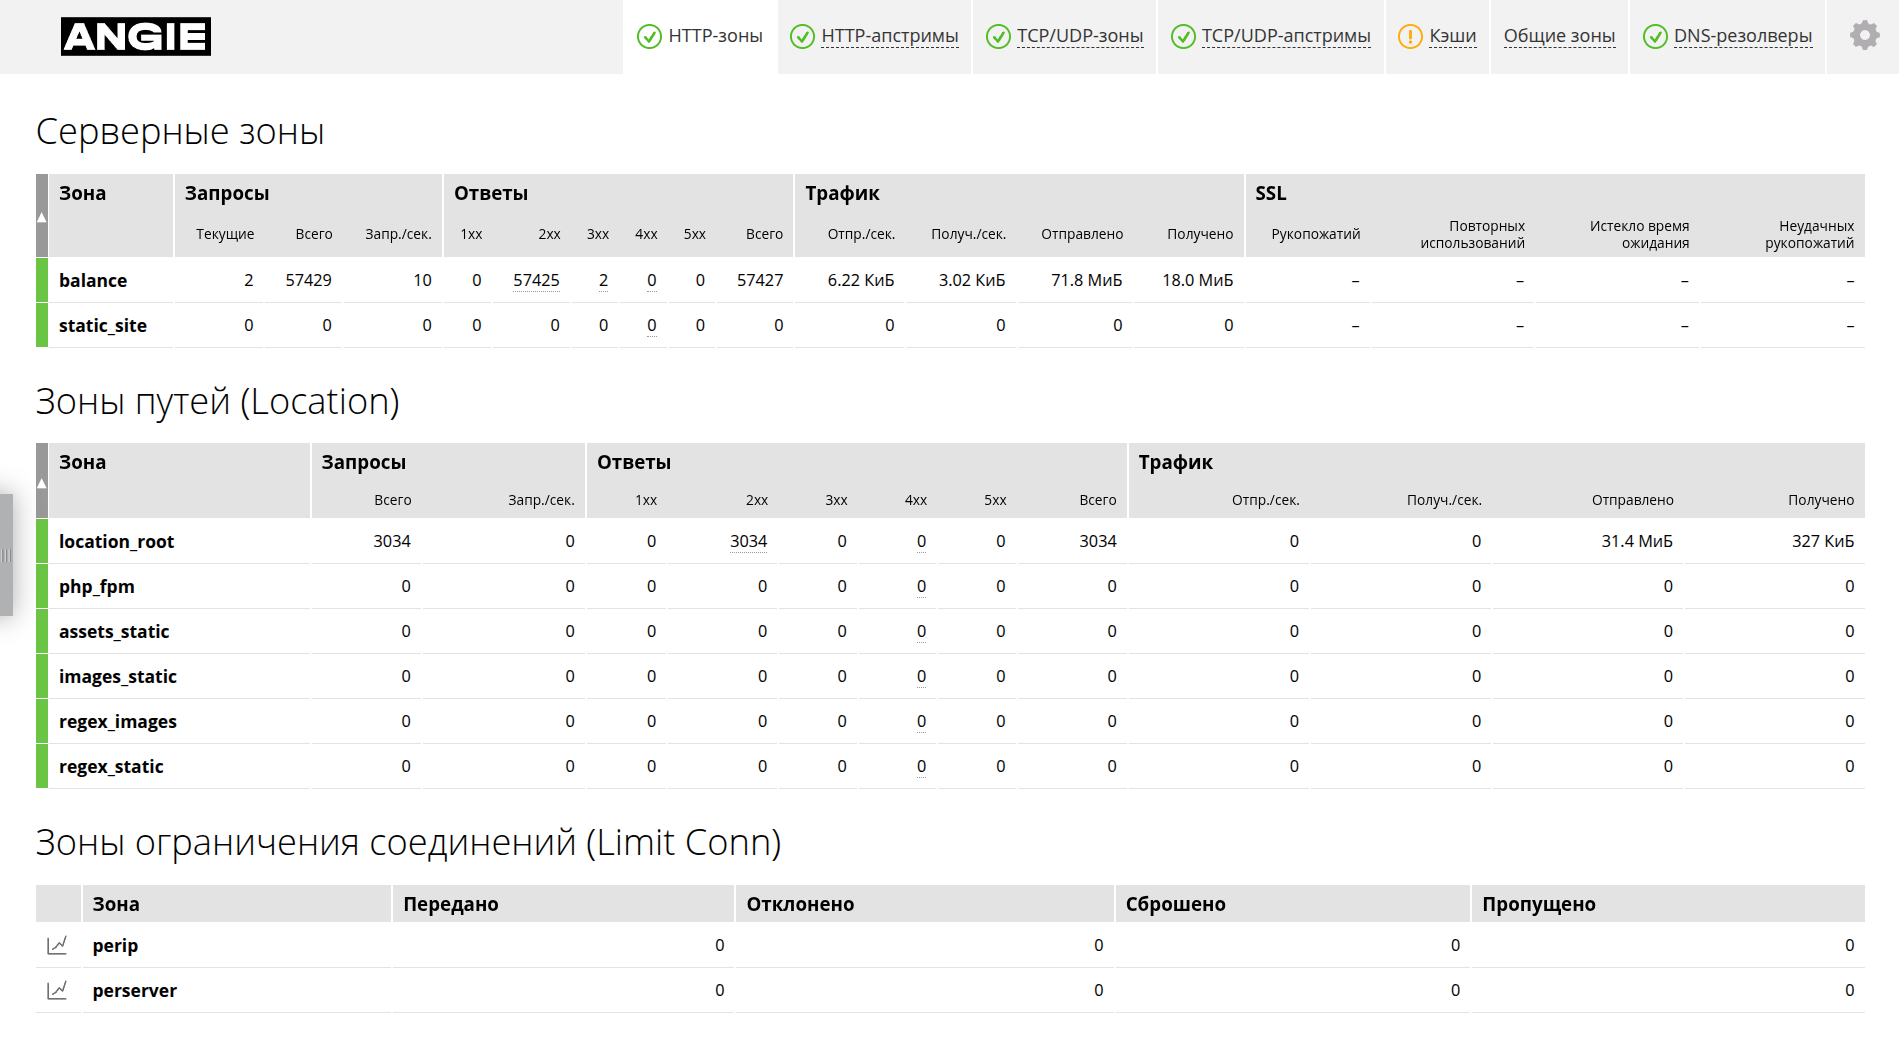
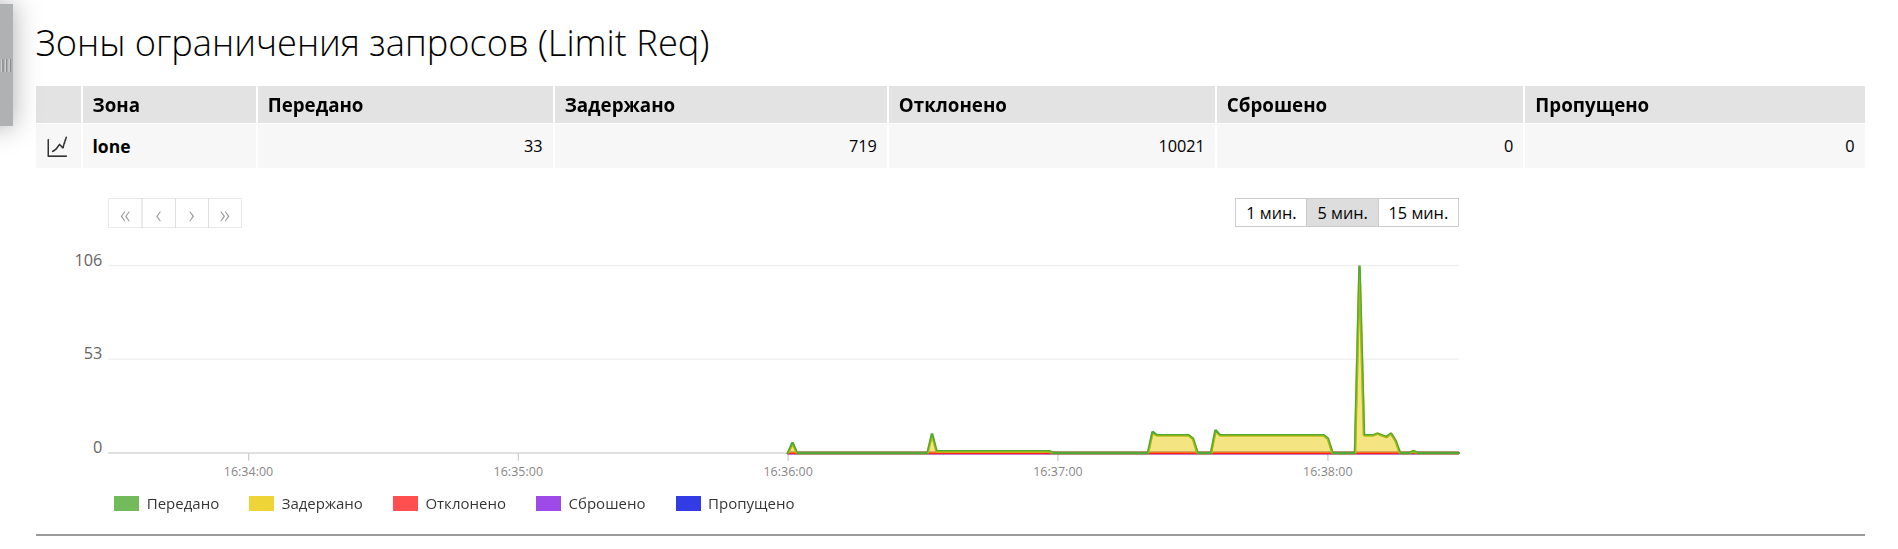
At the bottom of the same page you can watch the request-rate and connection-count limits in action. Clicking any limit opens a dynamic chart.
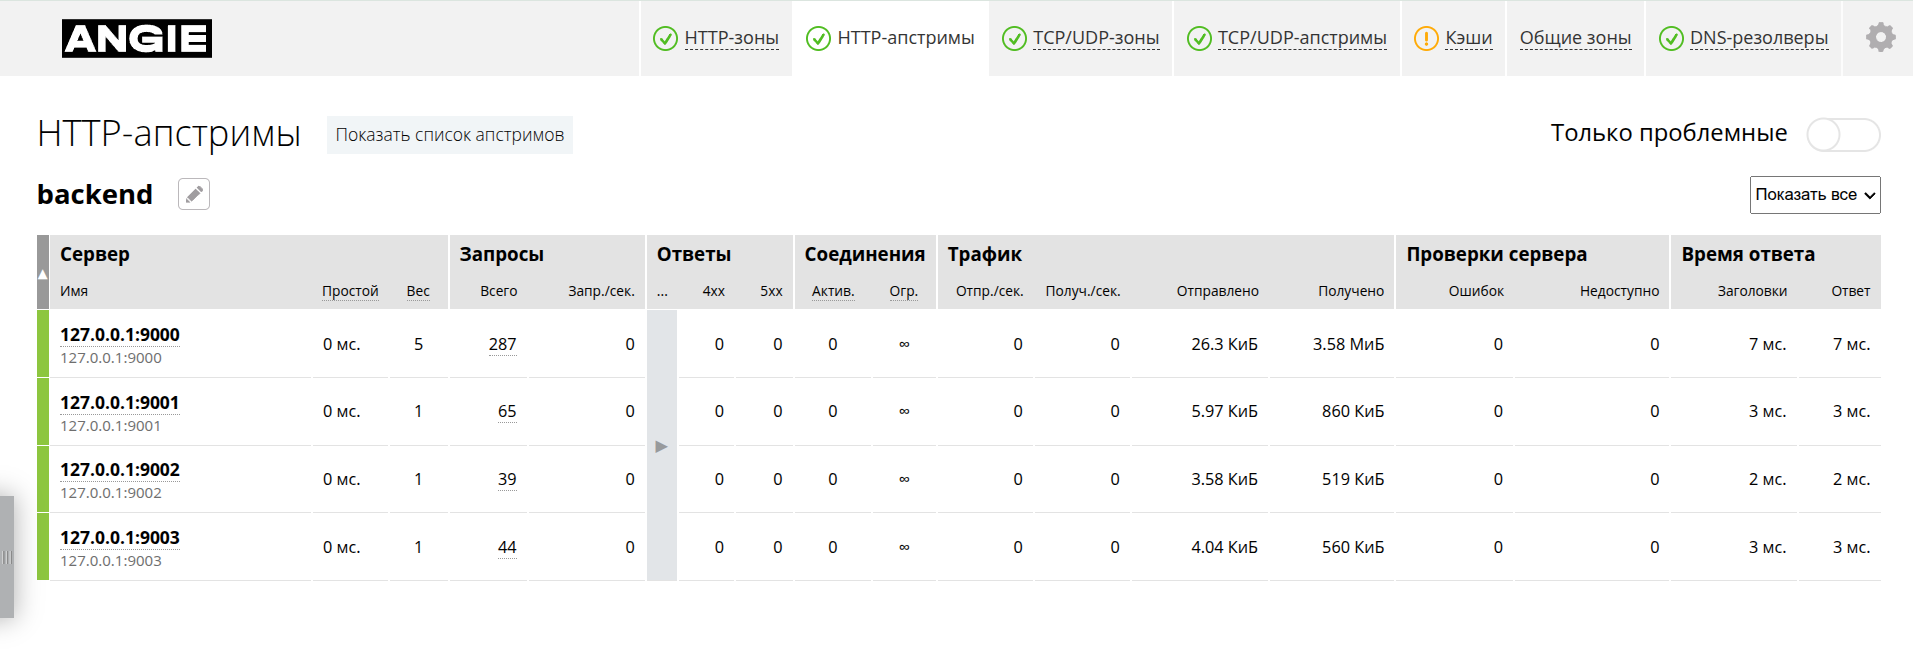
Next is statistics for HTTP upstreams. Here you can see their state and key metrics. In the PRO version, management is also available here (changing properties of each server, switching it to another mode).
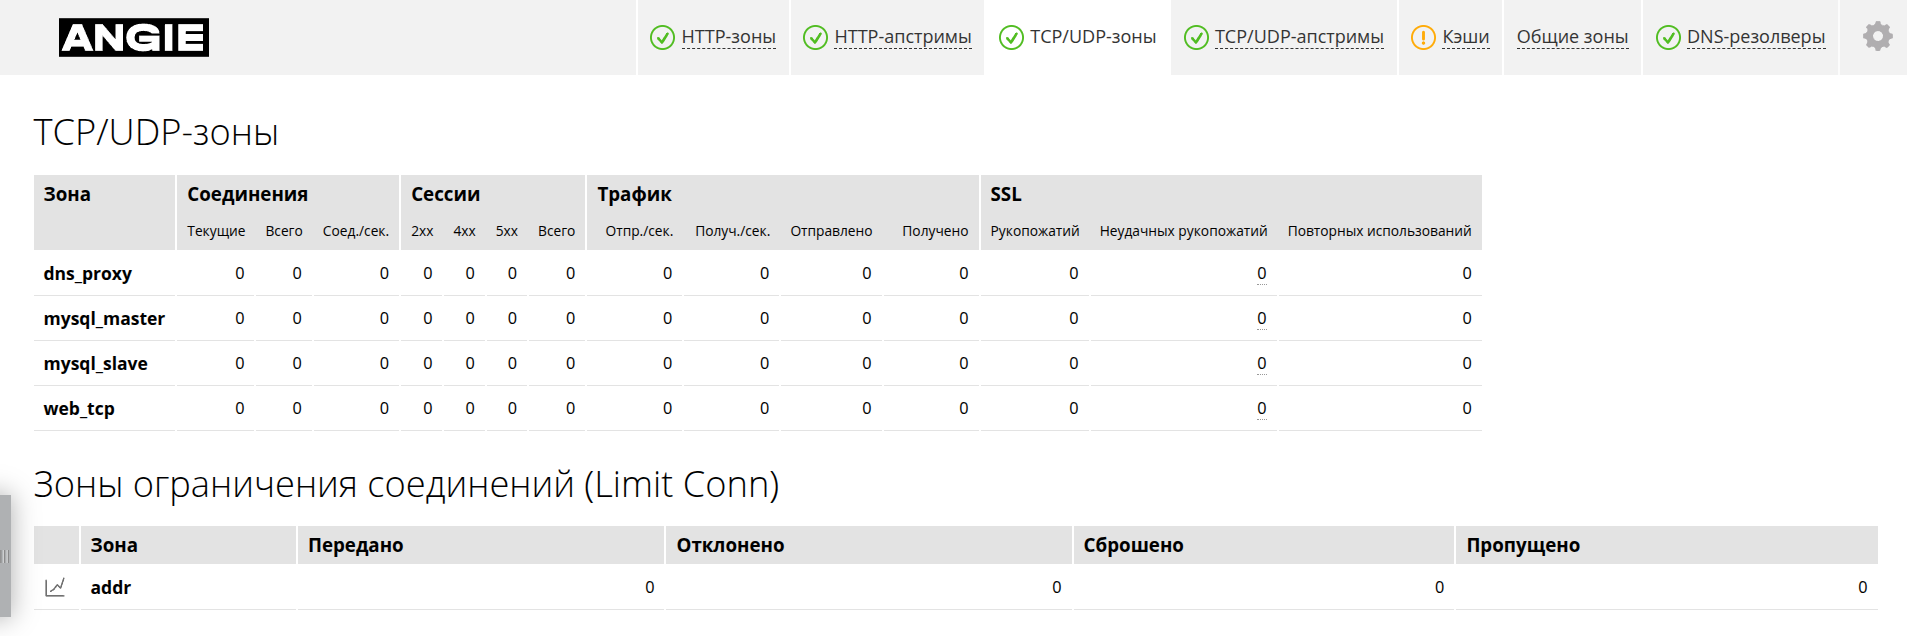
Next are the similar sections for L4 — TCP/UDP zones.
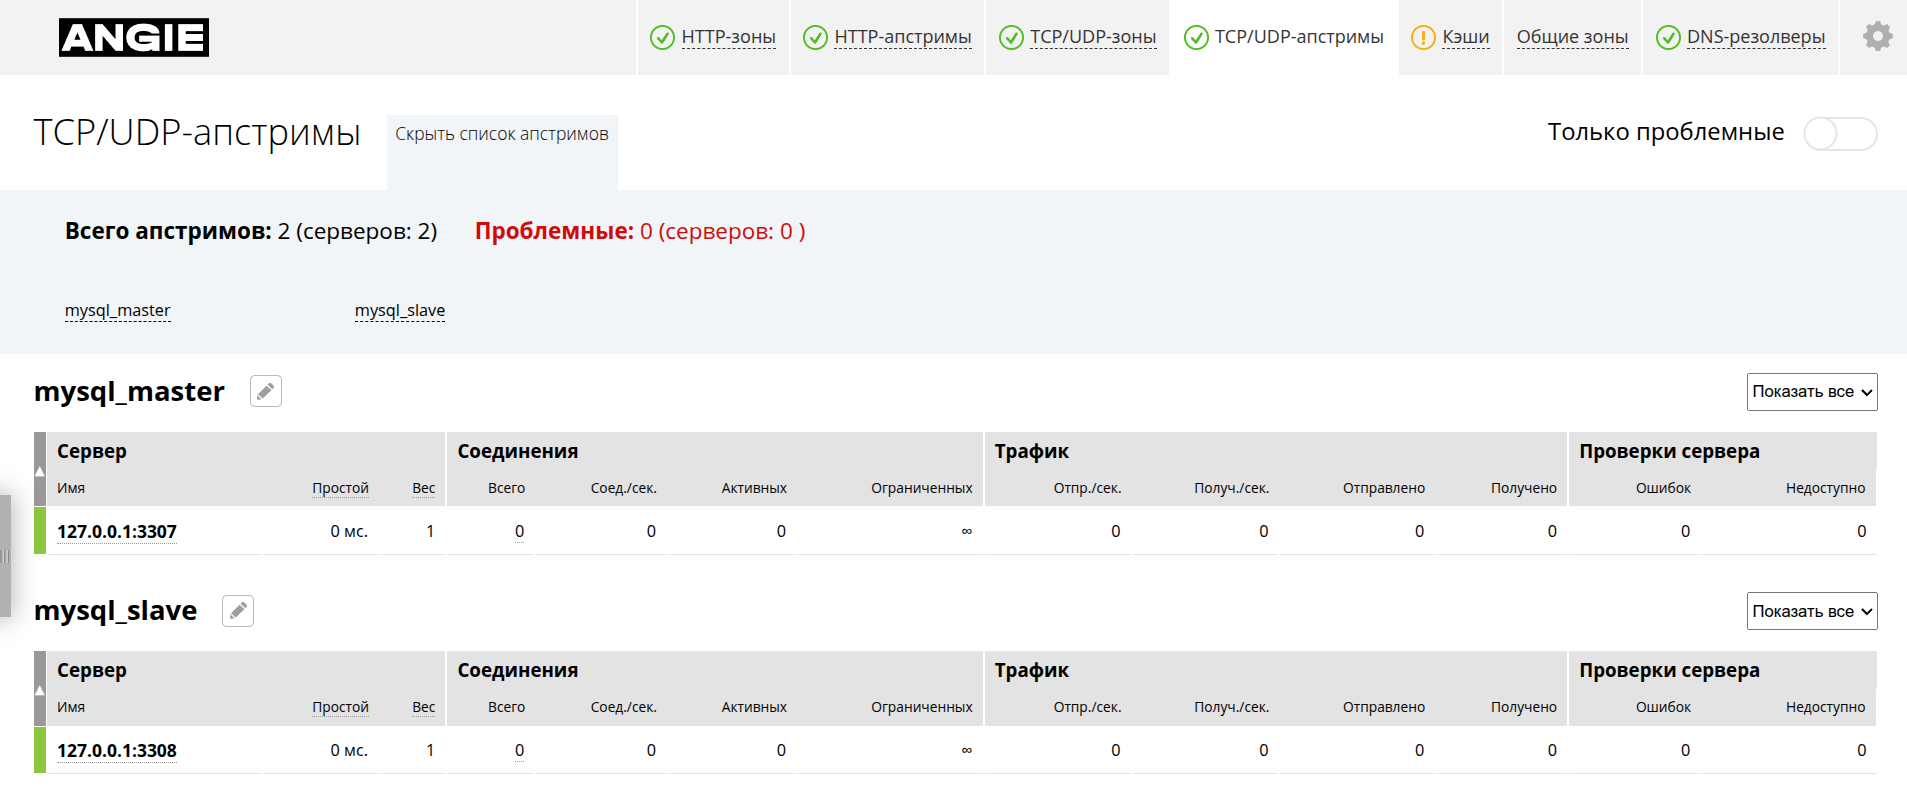
The next page: TCP/UDP upstreams. The structure is the same as for HTTP upstreams. The screenshot also shows that the "Problematic only" filter can be applied to the list, and the list of upstreams can be expanded.
Next is cache statistics. This page shows shared-memory zone usage, cache size on disk, traffic, and the hit rate.

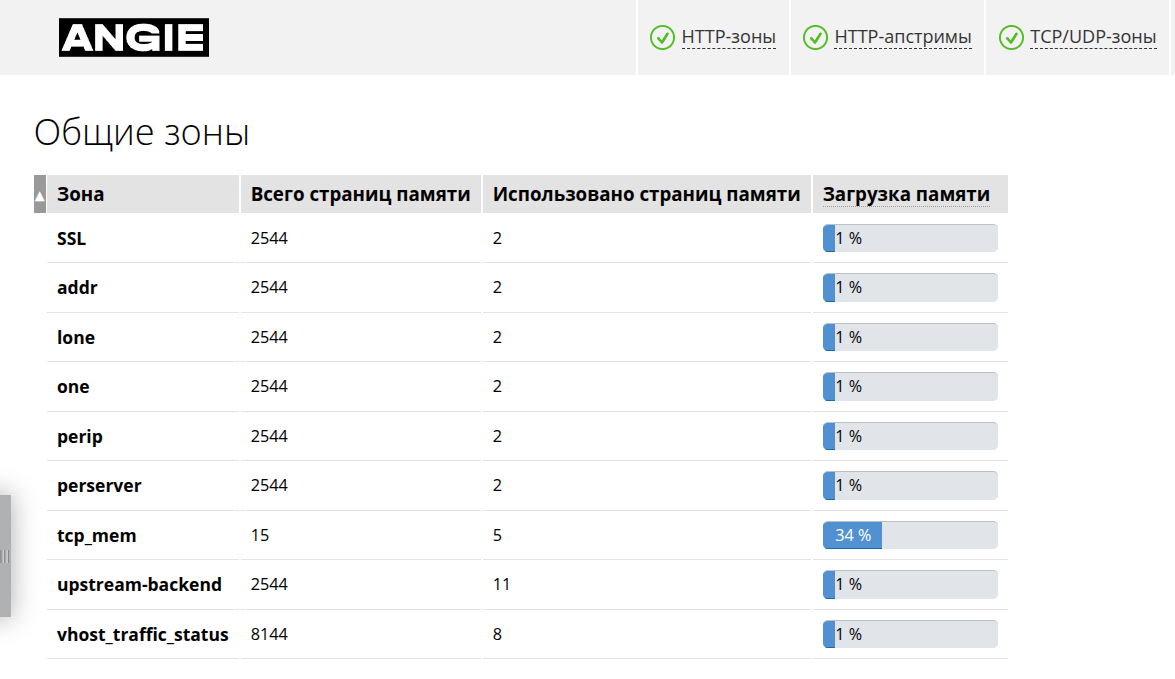
The next section — "General zones". It lists the shared-memory zones and their usage percentage.
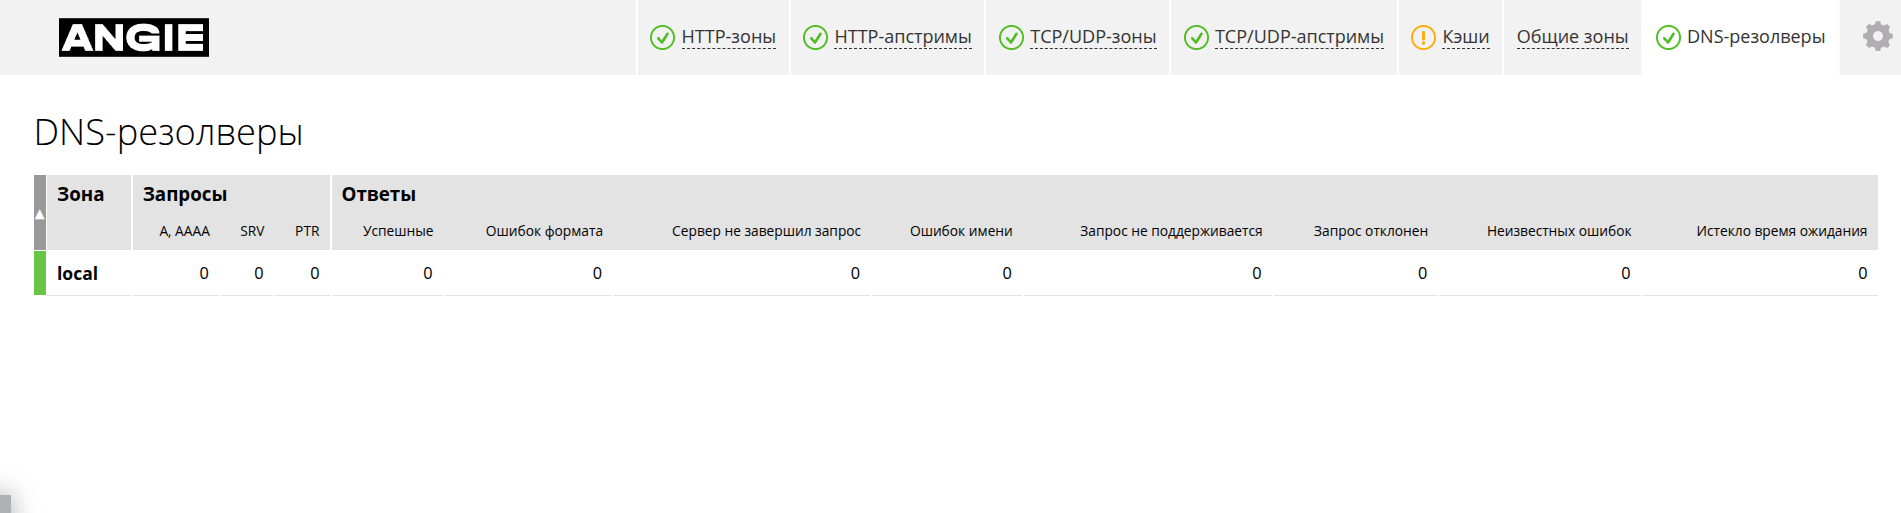
Finally, the console's last page: DNS resolvers, which shows resolver statistics.
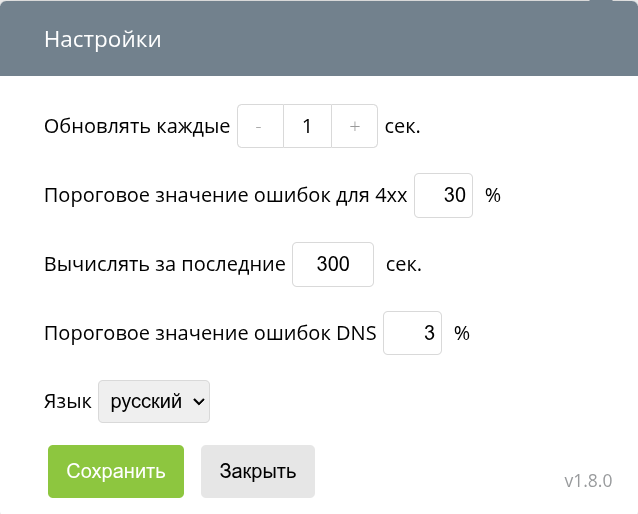
For operational monitoring, it is convenient that data updates without a page reload. The refresh interval can be changed in the settings panel (top right corner).
The Angie Console Light project is under active development, so it pays to keep an eye on new releases.
Summary
This article started with the classic stub_status module, then moved on to the API module and direct access to metric values. The Angie Console Light visual console runs on these metrics; it was configured at the end of the article. Angie's monitoring capabilities do not end there — there is, for example, a built-in Prometheus exporter.