
Tracking the core metrics of a web server or load balancer is the foundation of a reliable system. We covered monitoring through the API and Angie Console Light earlier, but that is not the only option Angie has. The built-in Prometheus exporter paired with Grafana visualization gives a different class of capabilities. This article sets up a full monitoring system for Angie.
Video version
For your convenience, a video version of this article is available on YouTube.
Enabling Prometheus metrics export
We already walked through the built-in Angie server API in an earlier article. The Prometheus module runs on top of that API; its job is to export metrics in a format compatible with Prometheus.
To get started we need a metrics template. The simplest way is to enable the ready-made template with the most in-demand server metrics. It ships in the file /etc/angie/prometheus_all.conf.
http {
  include prometheus_all.conf;
}
The file defines a template with a set of metrics. Part of that template is shown below.
prometheus_template all {
angie_connections_accepted $p8s_value
    path=/connections/accepted
    type=counter
    'help=The total number of accepted client connections.';

angie_connections_dropped $p8s_value
    path=/connections/dropped
    type=counter
    'help=The total number of dropped client connections.';
...
}
Some metrics in the template are defined with regular expressions that capture variables, so the metrics depend on how statistics collection is configured through the API module. For example, statistics collection can be set up with the zone and status_zone directives. We discussed how to configure them in the article on the API and Angie Console Light.
Angie PRO exposes more metrics through the API, so its prometheus_all.conf differs from Angie OSS. Angie PRO, for example, has metrics for proxied server response times and data from active health checks.
The metrics template is enabled, but we also need to publish the metrics at a path Prometheus can reach. Create a /p8s location with the prometheus directive.
server {
  listen 80;
  location =/p8s {
    prometheus all;
  }
}
We passed all as the parameter of the prometheus directive, which matches the name of our template (in the prometheus_all.conf file).
You can check metric availability in a browser at the configured location (/p8s) or from the terminal.
curl http://localhost/p8s

# Angie Prometheus template "all"
# HELP angie_connections_accepted The total number of accepted client connections.
# TYPE angie_connections_accepted counter
angie_connections_accepted 11
Metrics export is configured; next up is collecting the data in Prometheus itself.
Collecting metrics in Prometheus
Start by installing Prometheus (the remaining steps use Ubuntu 24.04). The package is in the default repository, so install it.
apt install prometheus
No exporter needs to be installed: Angie exports its own metrics.
Now open its configuration (/etc/prometheus/prometheus.yml) and add a job for Angie under scrape_configs. Remember that YAML files are sensitive to indentation before directives (each nesting level is two spaces).
 - job_name: "angie"
    scrape_interval: 15s
    metrics_path: "/p8s"
    static_configs:
      - targets: ["localhost:80"]
This example uses the /p8s location, which holds the metrics, and addresses localhost on port 80. To add other servers, list them in the targets directive separated by commas. Keep checking that the Prometheus server can reach the metric locations over the network.
Prometheus has its own web interface on port 9090. You can verify metric collection by querying their values directly, and it can build a simple chart of how a metric changes over time.
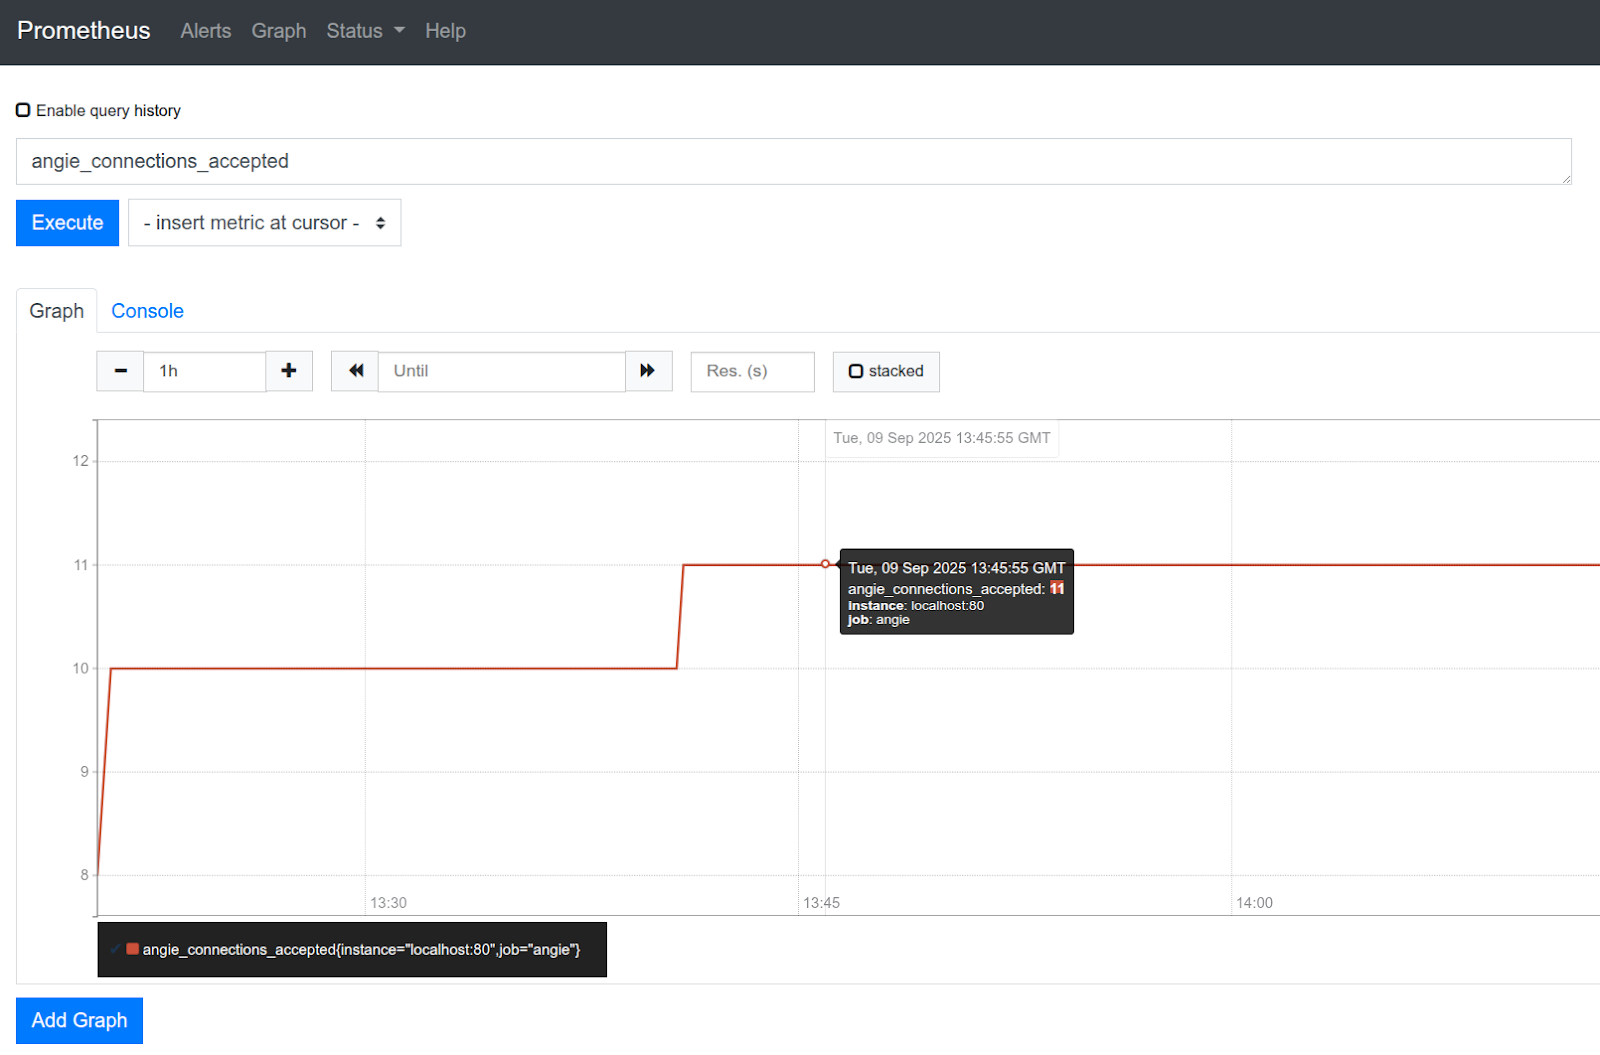
The metrics are flowing into Prometheus; all that's left is to set up metric visualization in Grafana.
Setting up a dashboard in Grafana
As always, start with installing Grafana. Open the product's download page (pick the OSS edition) and run the recommended package commands (the version changes constantly, so it makes sense to copy the commands from that download page).
sudo apt-get install -y adduser libfontconfig1 musl
wget https://dl.grafana.com/grafana/release/12.1.1/grafana_12.1.1_16903967602_linux_amd64.deb
sudo dpkg -i grafana_12.1.1_16903967602_linux_amd64.deb
If the Grafana server did not start after installation, start it manually.
systemctl daemon-reload
systemctl enable --now grafana-server
The rest of the Grafana setup happens in the web interface. Grafana listens on port 3000 by default. The default login and password are admin — change the password right away.
The first thing to do in Grafana is add the Prometheus data source. Go to Data sources > Add data source and enter the Prometheus address and port (in our case http://localhost:9090).
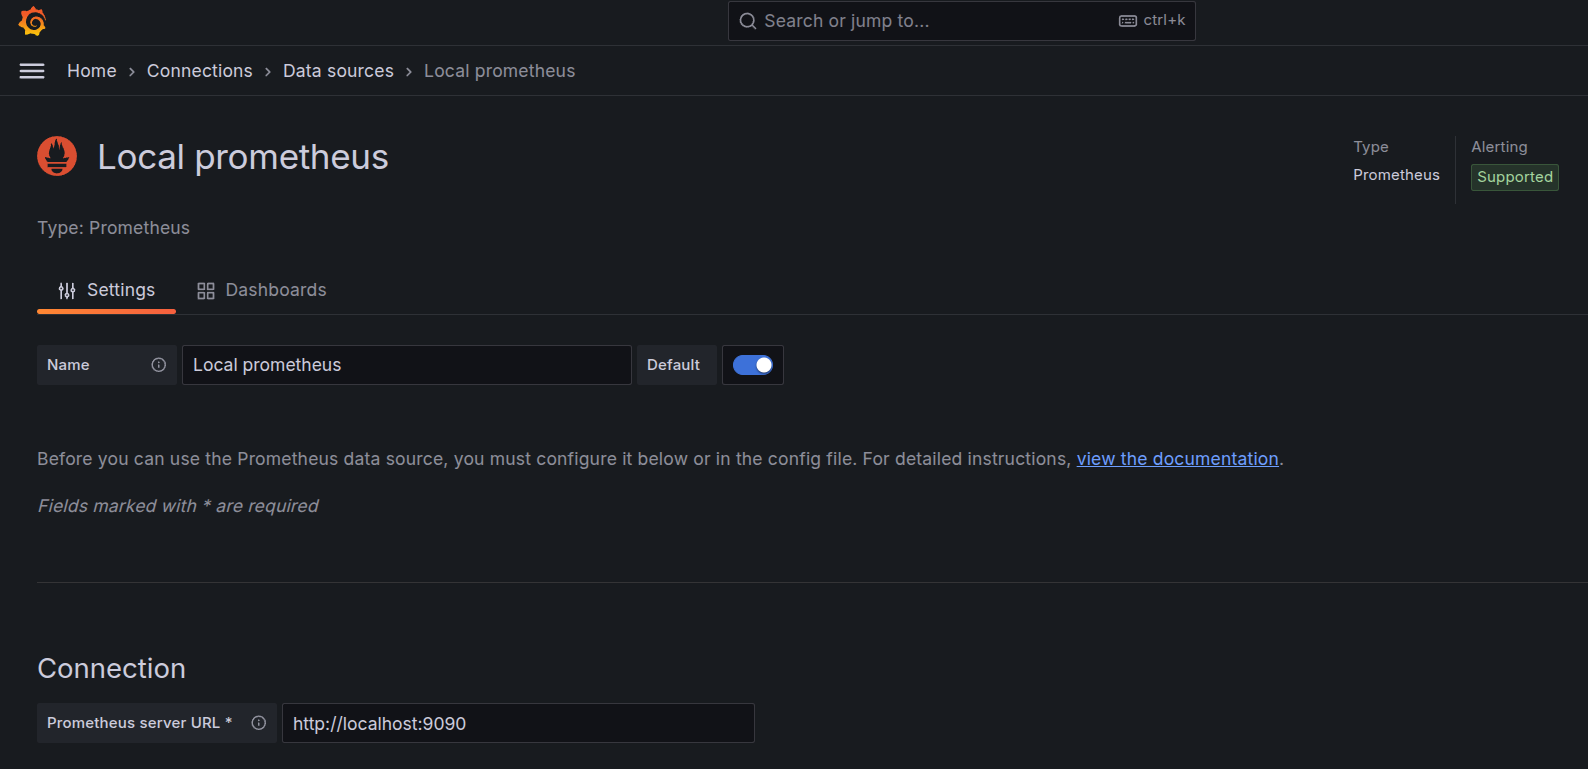
Grafana now has access to all the metrics Prometheus collects; all that's left is to add a dashboard. If Node Exporter was installed by default, you can add a dashboard for it — it shows all the core system metrics. For Angie there is a dedicated dashboard, which we add now: copy the dashboard ID or its JSON code and import it under Dashboards > Import.
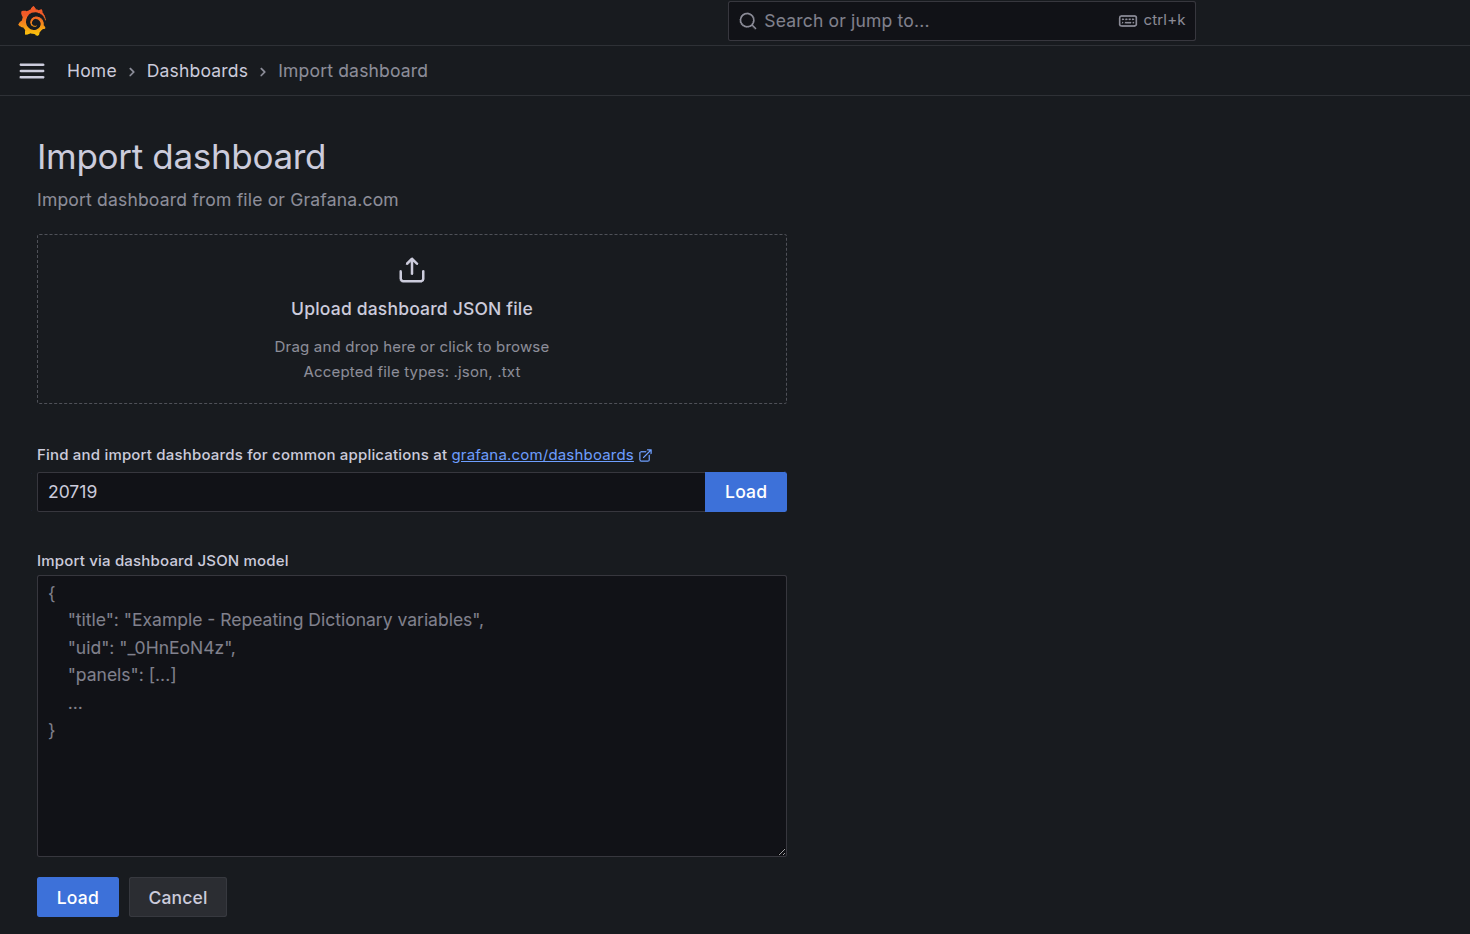
After loading it, set the dashboard name and the data source.
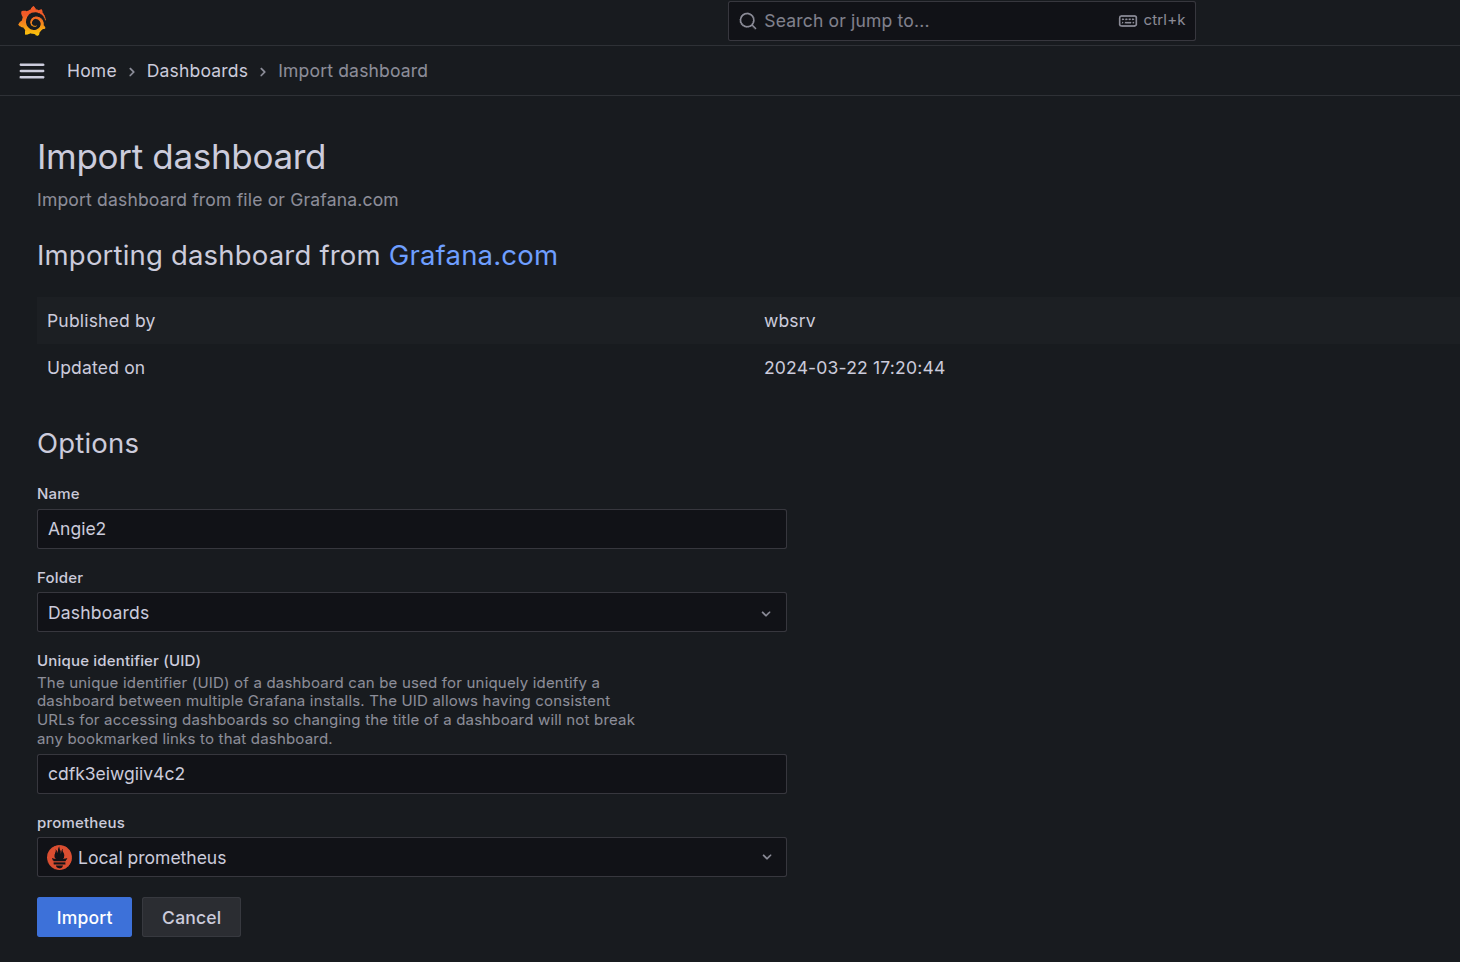
If everything is entered correctly, the Dashboards section shows the data coming from Angie into Prometheus as charts. If you don't see any charts, pick a shorter time range in the top-right corner (15 minutes, for example).
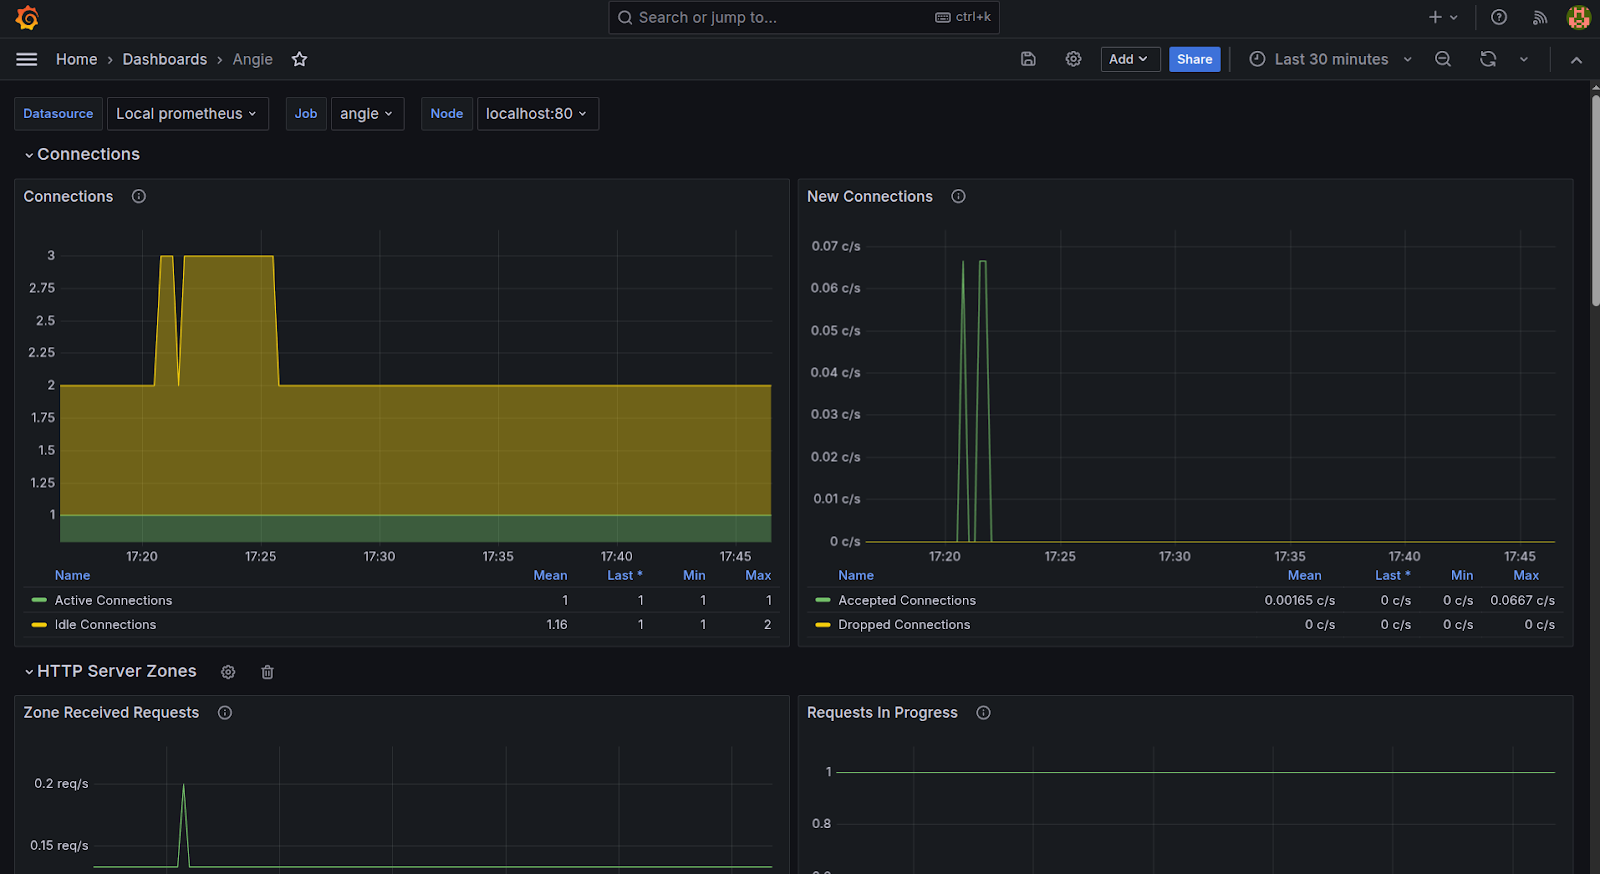
The data is on screen, and you can pick the time period you need. From there you can tune the dashboard for your own tasks with Grafana's standard tools.
Summary
We set up a system for collecting and visualizing Angie metrics on Prometheus and Grafana. Such a system lets you watch the server's key indicators and investigate incidents after the fact, thanks to stored historical data.