
This article walks through how observability works in xk6-sip — an extension for the load-testing tool k6 that automates load and functional testing of VoIP/SIP calls: where the metrics come from, how panels are built from them, and how to tell PBX degradation from degradation of the generator itself.
Every chart and number comes from a real load test run: 100 concurrent calls, 10 minutes, 2000 calls, 6.1 million RTP packets. The dashboard has 37 panels in six blocks; for each block below you get the data source, the query, the measured value, and the signs of trouble.
Scope of the article. All metrics below are client-side: xk6-sip collects them on the traffic generator side, and they show the PBX the way subscribers see it, plus the state of the generator itself. Server-side monitoring — PBX resources, its SIP stack, media servers, and dependencies — is out of scope. Client-side metrics answer the question what broke and when; the question why is answered by the server side, which we cover at the end.
Profile and expected values
The run is launched with two commands. The first brings up a test PBX testpbx on loopback and creates 200 subscribers in it from a CSV. The second runs k6 with the xk6-sip extension: metrics go to Prometheus via remote write, and the testid and pbx_version tags mark the run so the dashboard shows only it. What exactly the scenario does and what rig it ran on is in the table under the commands.
testpbx -addr 127.0.0.1:5070 -users 200 -csv examples/subscribers.csv

K6_PROMETHEUS_RW_SERVER_URL=http://localhost:9091/api/v1/write \
K6_FEATURES=native-histograms \
k6 run -o experimental-prometheus-rw \
  --tag testid=load-100x10m-2 --tag pbx_version=testpbx-0.4 \
  -e VUS=100 -e HOLD=30 -e DURATION=10m \
  -e SIP_METRICS_ADDR=127.0.0.1:6566 examples/call.js
| Parameter | Value |
|---|---|
| Scenario | A → B, caller ID check, isHeard() both ways, 30 s + U(0, 1) conversation, BYE from B |
| Executor | constant-vus, 100 VUs; one VU = two subscribers and one call at a time |
| Subscribers | 200, digest auth on REGISTER (401) and INVITE (407), Expires 300 s |
| Media | G.711 μ-law, 20 ms, 50 pps per leg |
| SUT | testpbx (registrar + B2BUA) on the same host, loopback |
| Generator | Windows 11, 16 GB RAM, no isolation from other load |
Before reading the dashboard, compute the expected values. By Little's law L = λW: with L = 100 and W ≈ 31 s (conversation + setup + iteration pause) we get λ ≈ 3.2 CAPS and ≈ 1930 calls in 10 minutes. RTP: 100 × 2 legs × 50 pps = 10,000 pps; at 172 bytes of UDP payload (12 bytes RTP header + 160 bytes G.711) that is 1.72 MB/s in each direction. Registrations: 200 at start + two refreshes in 10 minutes = 600.
If the dashboard reproduces these numbers on a clean run, the metrics pipeline is correct, and its readings can be trusted in a run with degradation.
Metrics collection architecture
Three data sources with different delivery models. The split is fundamental: test metrics describe the SUT as the subscriber sees it, process and host metrics describe the state of the generator. Without the second and third sources, jitter from a CPU-starved generator is indistinguishable from PBX jitter.
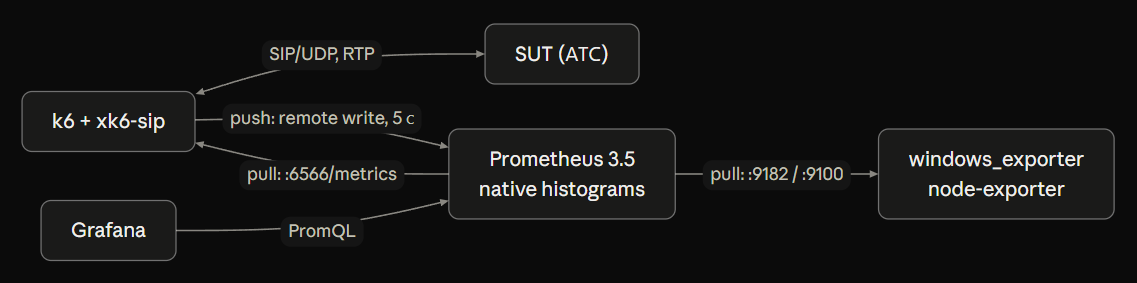
| Source | Model | Contents | Enabled by |
|---|---|---|---|
| Test metrics | push, remote write | sip_*, rtp_* with testid, pbx_version, scenario tags |
-o experimental-prometheus-rw |
| k6 process | pull, /metrics |
process_*, go_*, xk6sip_network_*, xk6sip_calls_in_progress |
sip.options({ metricsAddr }) |
| Generator host | pull | CPU, memory, network interfaces | windows_exporter / node-exporter |
Test metrics go by push: the test runs for a finite time, and the pull model would lose the tail after the last scrape. Process and host are long-lived targets, scraped every 5 s as usual. Process and host metrics carry no testid; correlation with the run is by time.
Why native histograms and counters
When exporting to Prometheus, k6 by default ships ready-made percentiles of trend metrics and shares of rate metrics accumulated since the start of the test. You cannot get a windowed value out of them: 10 minutes of degradation after an hour of normal barely move the accumulated p95. So:
- Times are exported as native histograms (
K6_FEATURES=native-histograms) and computed over a sliding window:
histogram_quantile(0.95, sum(rate(k6_sip_call_setup_time_seconds{testid=~"$testid"}[$window])))
A native histogram is one series per label combination with exponential buckets: boundaries are not chosen in advance, resolution adapts to the data, and degradation up to seconds does not hit the last bucket the way a classic histogram with le does. From it, rate() + histogram_quantile() give a percentile for any window, and histograms from several generators sum correctly — ready-made p95 values from different k6 instances cannot be added. The K6_PROMETHEUS_RW_TREND_AS_NATIVE_HISTOGRAM variable found in older guides is deprecated in k6 v2; histograms are enabled with K6_FEATURES=native-histograms. Prometheus 3.x accepts them with --web.enable-remote-write-receiver and --enable-feature=native-histograms; without the second flag the dashboard shows empty time panels.
- Shares are built from the extension's counters:
sip_call_results{result, status},sip_calls{phase},rtp_legs{heard}. The rate metricssip_call_successandrtp_audio_heardremain for script thresholds and the final report.
Known limitation: remote write in k6 sends a counter only on change. For series with rare spikes (REGISTER at start and on refresh) a window gets a single point, and rate() returns nothing. Such panels are built on accumulated values.
Below are dashboard snapshots for the run window 15:19–15:30, $window = 1 minute.
Overview: 12 indicators
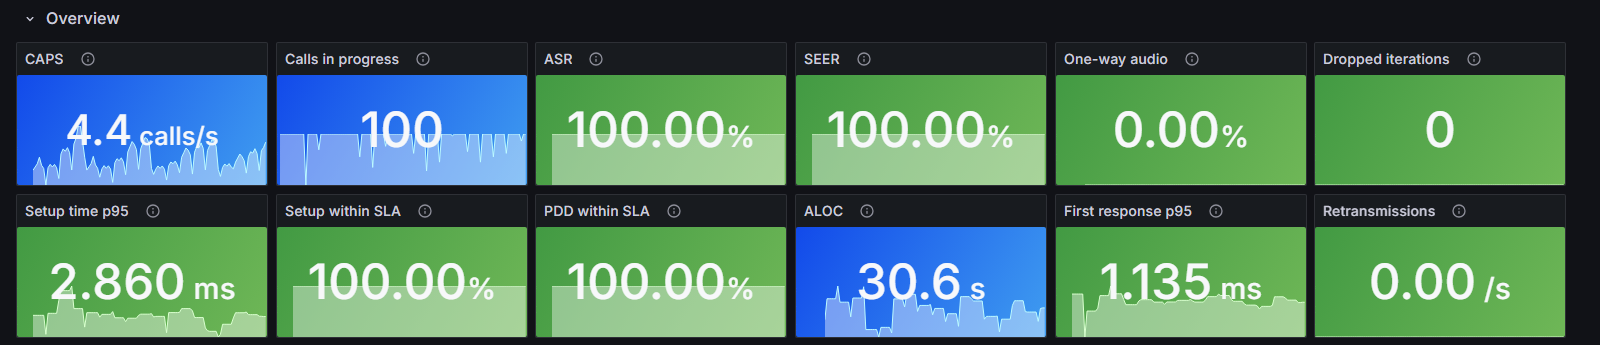
During a run, you look first at the 12 tiles of the top block. Each answers one question: is the load running as intended, are calls going through, is the voice audible, does the PBX stay within SLA. If the values match the expectations from the section above, there is no need to go down into the lower blocks; if a tile has deviated, it tells you where to look next — signaling, media, or the generator. The table below gives, for each indicator, how it is computed and what this run showed.
The top block is the early-warning system. All shares and percentiles are computed over $window — a Grafana dashboard variable, the length of the sliding window (1 minute in this run), not the whole test. So every point on a panel shows the last minute: CAPS is how many calls per second completed during that minute, p95 is computed over that minute's calls.
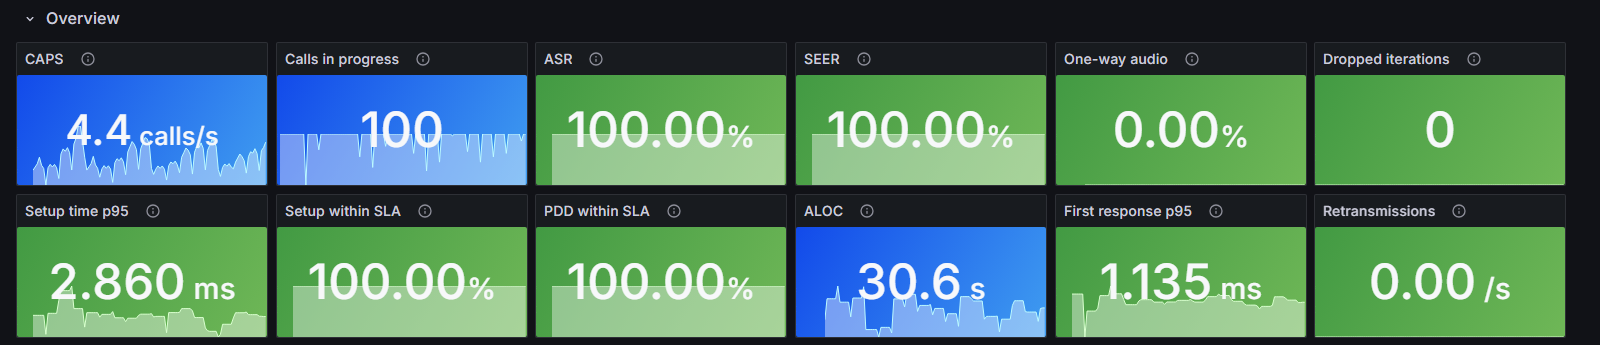
| Indicator | What it means in plain words | Definition | Run |
|---|---|---|---|
| CAPS | How many calls per second complete — the actual load intensity | sum(rate(k6_sip_call_results_total[$window])) |
3.1 (1.8–4.9) |
| Calls in progress | How many conversations are going on right now | sip_calls{phase="answered"} − sip_calls{phase="ended"} |
100 |
| ASR | Share of calls that were answered | answered / all attempts | 100% |
| SEER (RFC 6076) | Share of calls the PBX handled without failure: "busy", "no answer", and a subscriber rejection also count as network success | (200 + 480 + 486 + 600 + 603) / attempts without 3xx | 100% |
| One-way audio | Share of call legs that did not hear the other party | rtp_legs{heard="false"} / rtp_legs |
0% |
| Dropped iterations | How many planned calls the generator failed to start in time | k6_dropped_iterations_total |
0 |
| Setup time p95 | How long a call takes to connect — from dialing to the callee's answer; 95% of calls fit within this time | INVITE → final response | 2.9 ms |
| Setup within SLA | Share of calls connected faster than the SLA threshold | histogram_fraction(0, $sla_setup, …) |
100% at SLA 300 ms |
| PDD within SLA | Share of calls where the pause between dialing and the callee ringing (post-dial delay) is shorter than the SLA threshold | histogram_fraction(0, $sla_pdd, …) |
100% at SLA 2 s |
| ALOC | Average conversation duration | histogram_sum / histogram_count on sip_call_duration |
30.6 s |
| First response p95 | How fast the PBX acknowledges it received the call; 95% of calls fit within this time | INVITE → first transaction response | 1.1 ms |
| Retransmissions | How many times per second a SIP message had to be resent because the PBX did not answer in time | sum(rate(k6_sip_retransmissions_total[$window])) |
0 |
ASR vs SEER. ASR depends on the traffic profile: "busy" and "no answer" lower it without the PBX being at fault. SEER from RFC 6076 counts a subscriber rejection as network success and drops only on 404, 5xx, and timeouts. In this run both are at 100%. In a control run with 5% of calls to a nonexistent number and 5% busy, ASR came out 84% and SEER 92%: the gap is the 486s, while 404 stays in SEER as a routing failure. The pair "ASR drops, SEER holds" points at the subscriber profile; the pair "both drop" points at the PBX.
ALOC matches the script's configured 30 + E[U(0,1)] = 30.5 s (+0.1 s for the BYE). A drop in ALOC under steady load is a direct sign that the SUT is tearing sessions down (session timers, channel limits, RTP-proxy failures).
CAPS swings between 1.8 and 4.9 around a mean of 3.1. This is a property of the closed model constant-vus: 100 VUs start at once and finish calls in waves that spread out because of the random add-on to the duration. To find capacity you need an open model (constant-arrival-rate), where CAPS is set and does not depend on how fast the SUT answers.
Signaling
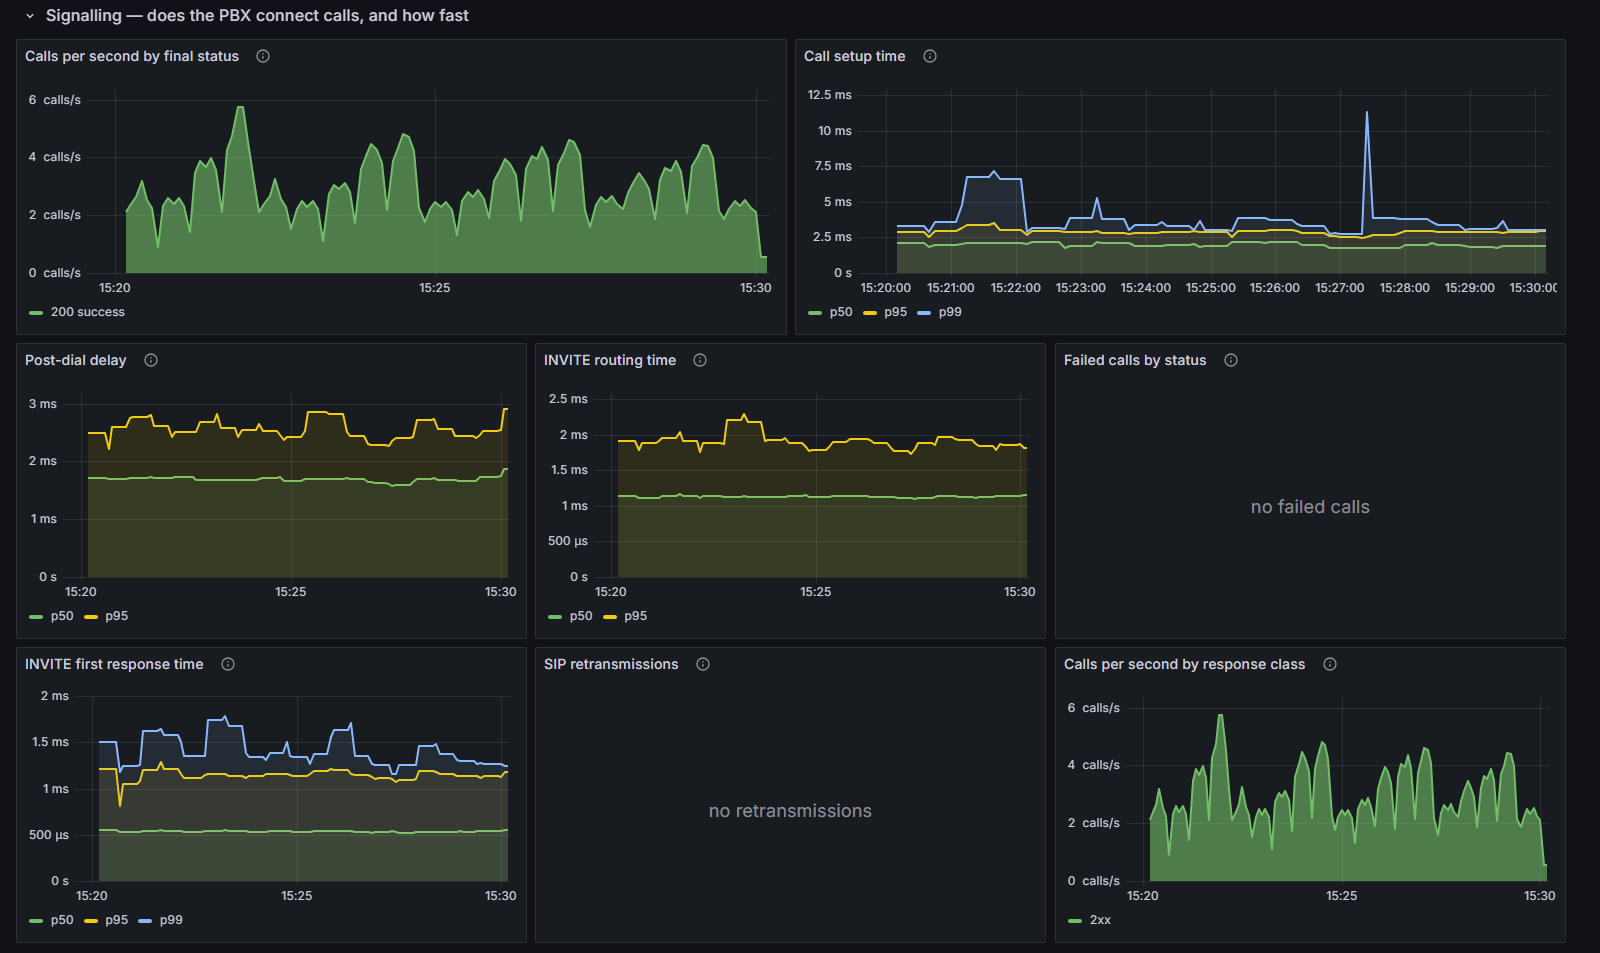
| Panel | Metric and measurement point | Run |
|---|---|---|
| Calls per second by final status / by class | sip_call_results{result, status}, final response to INVITE; classes via label_replace |
only 200 |
| Call setup time | sip_call_setup_time: INVITE sent → 200 OK, including the 407 round trip + retry with credentials |
p50 1.9 / p95 2.9 ms |
| Post-dial delay | sip_post_dial_delay: INVITE → first 18x |
p95 2.5 ms |
| INVITE routing time | sip_invite_delivery_time: INVITE sent by device A → received by device B |
p95 1.9 ms |
| INVITE first response time | sip_invite_first_response_time: INVITE → first transaction response, one sample per transaction (407 and 100 Trying) |
p95 1.1 ms |
| SIP retransmissions | sip_retransmissions{method, kind, status} |
0 |
| Failed calls by status | increase(...[$__range]) on status |
— |
Routing time is a metric a generator with separate UAC and UAS cannot produce: both timestamps are taken by one process, with no clock skew. It is the SUT's pure routing work.
First response and retransmissions
Per RFC 3261 (17.1.1.2), a client INVITE transaction over UDP retransmits the request on timer A: after T1 = 500 ms, then 1, 2, 4 s — until the first response or timeout B = 64·T1. So the first-response panel carries a 500 ms threshold: while p99 stays below T1, the PBX keeps acknowledging transactions in time; above it, every slow response doubles the incoming INVITE stream. A threshold on setup time does not work here: it includes the time until the callee answers, and retransmissions are already stopped by 100 Trying.
Retransmissions are performed by sipgo's transaction layer, and the extension observes them: the device's SIP socket is wrapped, and re-writing a message with the same Via branch, CSeq, and start line counts as a retransmission. Both requests (kind="request") and final responses not acknowledged by ACK (kind="response", timer G) are counted.
Overload signature
A clean run has no signature, but this is what the block exists for. Typical sequence on SIP/UDP:
- p99 setup time rises while p50 stays flat — a queue appears in the SUT.
- p99 first response approaches 500 ms.
- INVITE retransmissions appear: the actual load on the SUT exceeds the configured load.
- 503 / 408 appear, SEER drops.
Steps 1–3 expose the PBX ceiling before it shows up as failures. By step 4 the system is already in avalanche overload, and lowering CAPS does not pull it out right away.
Media
Successful signaling does not guarantee voice: NAT, SDP errors, or media server port exhaustion produce a call with 200 OK and silence on one side. So every call generates RTP in both directions, and each leg reports at the end of the call whether it heard the other side.
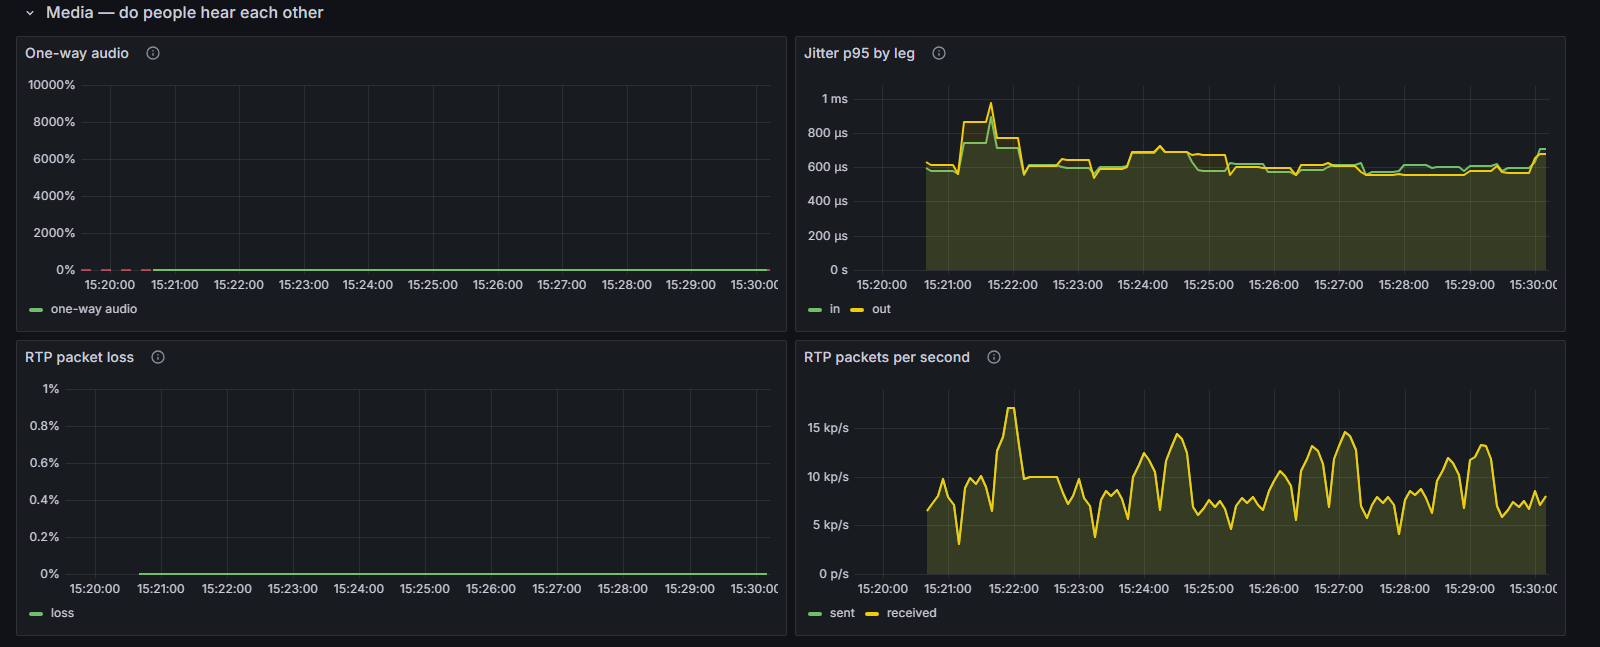
| Panel | Metric | Run |
|---|---|---|
| One-way audio | rtp_legs{heard="false"} / rtp_legs, per leg |
0 of 4000 |
| Jitter p95 by leg | rtp_jitter, interarrival jitter estimate per RFC 3550 (6.4.1), by direction |
0.6 ms on both legs |
| RTP packet loss | rtp_packets_lost / (received + lost); losses detected from sequence number gaps |
0 |
| RTP packets per second | rtp_packets_sent, rtp_packets_received |
9673 pps |
Cross-check. The theoretical maximum is 10,000 pps. Of a 31.25 s iteration, media runs for about 30.6 s (ALOC), that is ~98% of the time, giving ~9800 pps; measured 9673. Over the test, 6,119,611 packets were sent and 6,119,571 received. The loss counter is still zero: 40 packets were in flight at the moment of BYE and arrived after the stream closed, with no sequence gaps.
Phase shift. RTP metrics are published when a leg completes, and the media panels lag signaling by ALOC: ~30 s in this run. When correlating a jitter spike with an event in signaling or on the generator, shift media back by the call duration.
Registrations and scenario
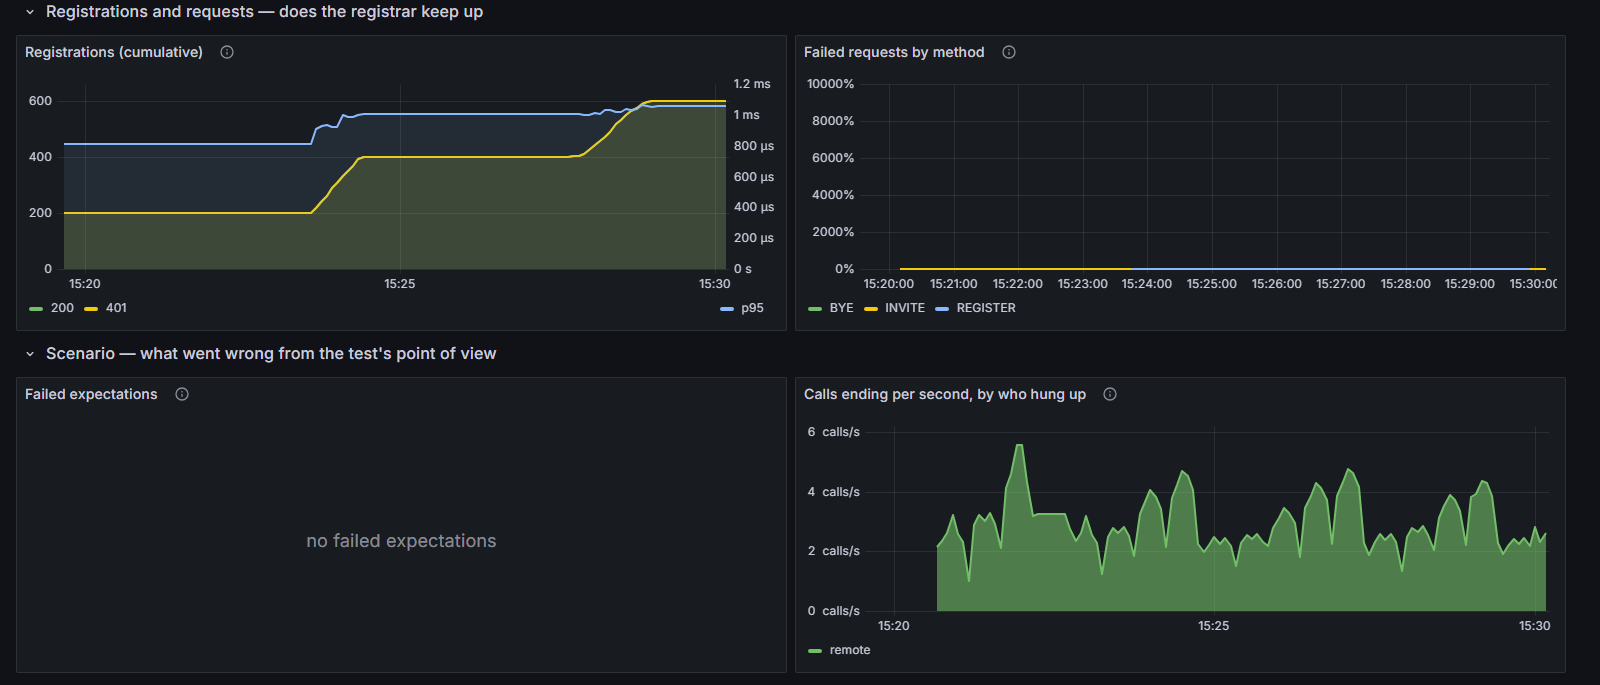
- Registrations arrive in bursts, so the panel is cumulative: 200 → 400 → 600, one step per start and per refresh at Expires 300 s. As many 401s as 200s: every registration goes through a digest round. p95 REGISTER response is about 1 ms.
- Failed requests by method — 0 of 7200 requests. 401 and 407 are not errors, otherwise the "error" share would be 36% out of nowhere: 2600 challenge responses for 1200 REGISTER, 4000 INVITE, and 2000 BYE.
- Failed expectations — 0 of 8000 checks. This is a scenario-level metric:
call— the call did not arrive or arrived with the wrong caller ID,heard— no audio,transferred— the transfer did not go through. A successful 200 OK with the wrong caller ID shows up only here. - Calls ending by who hung up — all
remote: the metric is written from side A, and B sends the BYE. The anomaly is notremoteitself but a mismatch with the scenario: appearance oferror/timeout, or a drop in ALOC.
Generator
A load test is invalid if the generator became the bottleneck. For VoIP this is especially nasty: with a CPU shortfall the RTP scheduler sends packets late, and the receiving side records it as SUT jitter. The generator block exists to validate the test itself.
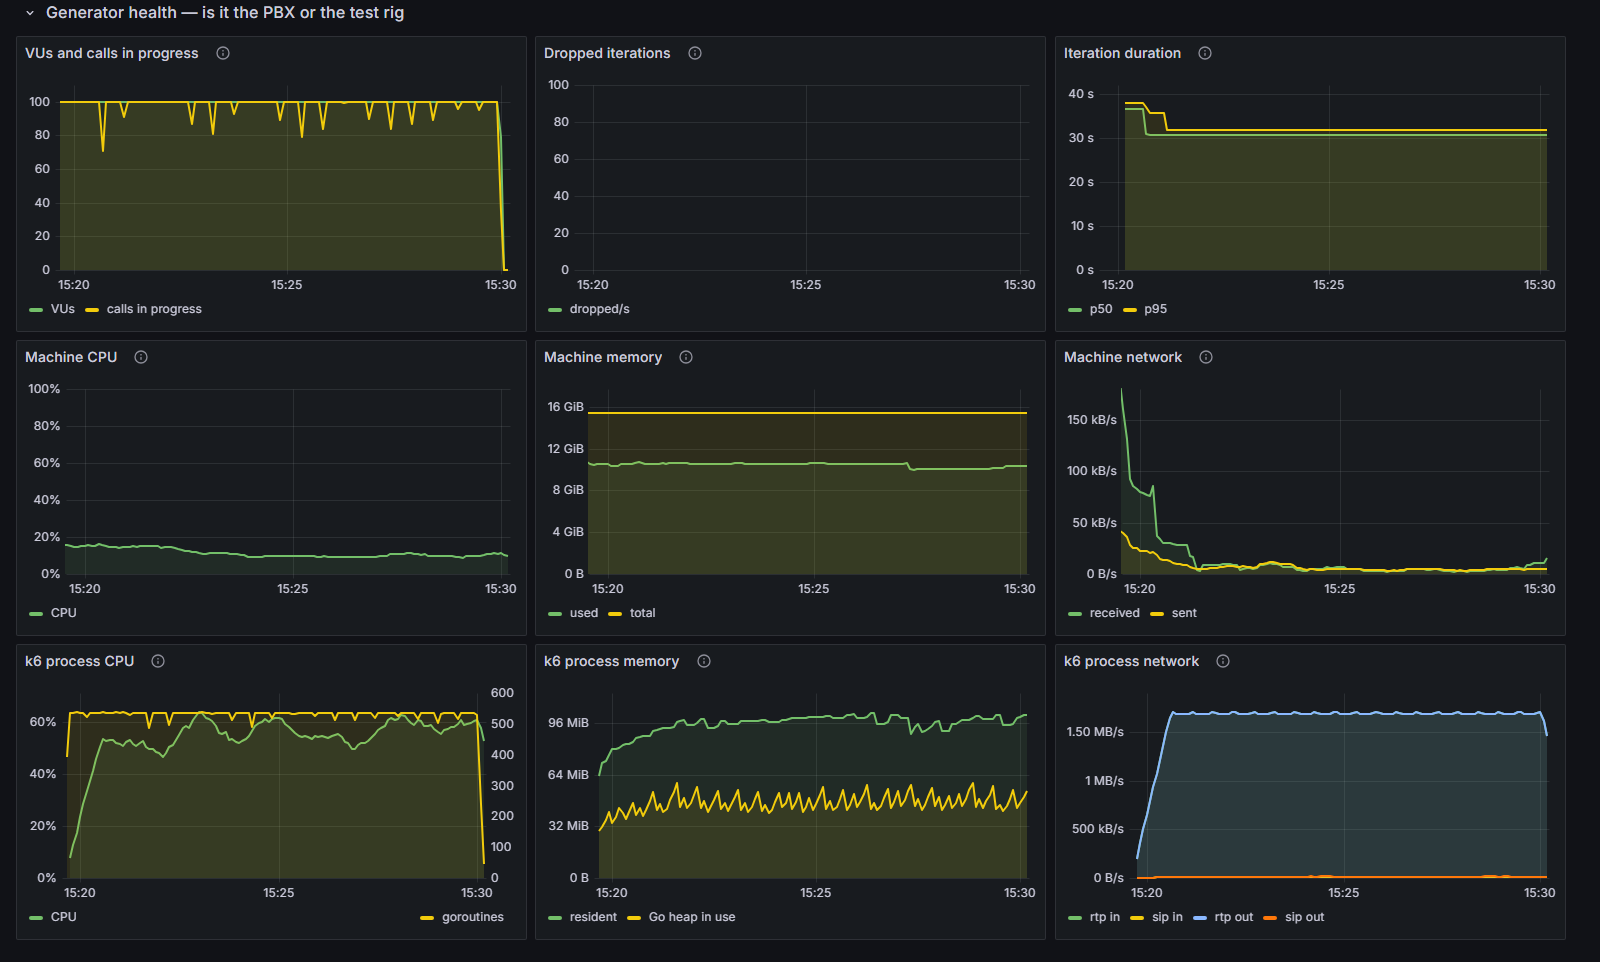
Process metrics are exposed by the extension itself on metricsAddr: the standard process and Go collectors from client_golang, plus the extension's own traffic counters at the SIP and RTP socket level.
| Panel | What it shows | Metric | Run |
|---|---|---|---|
| Dropped iterations | How many calls the generator failed to start on schedule | k6_dropped_iterations_total |
0 |
| k6 process CPU | How much CPU k6 uses | rate(process_cpu_seconds_total{job="k6"}) |
55% of a core (peak 63%) |
| Goroutines | Number of parallel tasks inside k6; growth without growth in load means a leak | go_goroutines |
~530, stable |
| k6 process memory | How much memory k6 uses | process_resident_memory_bytes, go_memstats_heap_inuse_bytes |
RSS ~100 MB, heap 38–61 MB |
| k6 process network | How much traffic k6 sends and receives: voice (RTP) and signaling (SIP) | rate(xk6sip_network_bytes_total) by proto, direction |
RTP 1.65–1.70 MB/s, SIP ~12 KB/s |
| Machine CPU / memory | CPU and memory load of the whole generator machine | windows_exporter | 11% CPU, 11.2 of 16 GB |
Stability. Goroutine count and RSS plateau after ramp-up and do not grow with the number of completed calls, while heap saws with GC cycles and shows no trend — there are no goroutine or per-call memory leaks. For soak tests this is the first thing to check.
Traffic cross-check. Computed 1.72 MB/s of UDP payload in each direction, measured 1.65–1.70. rtp in and rtp out match because a single process serves both legs of a call. SIP is under 1% of the traffic.
Loopback vs NIC. The SUT ran on 127.0.0.1, so "Machine network" does not see the test: loopback traffic does not pass through a network interface, and the host exporter does not count it. The socket counters see everything. With a remote SUT both panels match to within the IP/UDP headers (28 bytes per packet, +16% for G.711 at 20 ms). A discrepancy larger than that means third-party traffic on the generator.
CPU. 55% of a core for 200 RTP streams and 3 CAPS. That is higher than the extension's isolated benchmark (62% for 1000 streams on Linux), and the gap is explainable: Windows, with the SUT and the generator on the same host, plus remote write and the export of the process's own metrics. The conclusion: generator performance metrics have to be measured on the target platform, not carried over from a benchmark.
Host memory. The first attempt at this run was aborted at 4.5 minutes because the machine ran out of RAM with k6 RSS around 100 MB. This is exactly the case the process and host panels separate: the process is stable, the host is at the ceiling. In production-grade testing the generator has to run on a dedicated host.
Summary
The metrics pipeline reproduces the computed values on every axis:
| Quantity | Computed | Measured |
|---|---|---|
| CAPS | L/W = 100 / 31 ≈ 3.2 | 3.1 |
| Calls in the run | ≈ 1930 + iterations finishing during graceful stop | 2000 |
| Calls in conversation | 100 | 98.9 average |
| ALOC | 30.5 s | 30.6 s |
| RTP pps | ~9800 accounting for duty cycle | 9673 |
| RTP traffic per direction | 1.72 MB/s | 1.65–1.70 MB/s |
| REGISTER 200 OK | 200 × 3 | 600 |
| Failures, losses, one-way audio, retransmissions | 0 | 0 |
Scenario thresholds: sip_call_success 100% (threshold > 99%), rtp_audio_heard 100% (> 99%), sip_call_setup_time p95 2.87 ms (< 500 ms).
Millisecond times are a property of the test SUT on loopback, not a characteristic of a production PBX. Besides, on Windows Go's clock granularity is about 0.5 ms, so sub-millisecond percentiles here are approximate. The value of the run lies in validating the measurement tools before testing a real system.
Reproduction
git clone https://github.com/Dmitry-Fedotov-Dev/xk6-sip && cd xk6-sip
xk6 build v2.3.0 --with github.com/Dmitry-Fedotov-Dev/xk6-sip=. --output k6

docker compose -f monitoring/docker-compose.yml up -d        # Linux: --profile linux-host
go run ./cmd/testpbx -addr 127.0.0.1:5070 -users 200 -csv examples/subscribers.csv &

K6_PROMETHEUS_RW_SERVER_URL=http://localhost:9091/api/v1/write K6_FEATURES=native-histograms \
./k6 run -o experimental-prometheus-rw --tag testid=my-run --tag pbx_version=<version> \
  -e VUS=100 -e HOLD=30 -e DURATION=10m -e SIP_METRICS_ADDR=127.0.0.1:6566 examples/call.js
Grafana is at http://localhost:3001, Prometheus at http://localhost:9091. On Windows, host metrics come from windows_exporter with --collectors.enabled=cpu,memory,net,os,system --web.listen-address=127.0.0.1:9182. For your own PBX, a CSV with its subscribers is enough instead of the generated testpbx.
The dashboard lives in the repository as JSON — monitoring/grafana/dashboards/xk6-sip.json — and is picked up automatically through provisioning. Into an existing Grafana it can be imported as is; it needs a Prometheus data source with uid prometheus.
The second half of the picture: the server side
Everything above is the view from outside. The generator sees that setup p99 tripled, but not why. The cause lives on the PBX, and it needs its own set of metrics, collected on the same time scale and with the same run tags:
| The client (xk6-sip) sees | What to look at on the PBX |
|---|---|
| First response to INVITE climbing toward 500 ms, retransmissions appearing | Queue of incoming SIP messages and transactions, load of the SIP stack threads, UDP drops in the socket buffer |
| Setup p99 rising while p50 stays flat | Per-core CPU, response time of the database and external routing services, GC pauses |
| Fewer calls in conversation than answered − ended | Number of active channels and dialogs, license and trunk limits |
| One-way audio with a green ASR | Sessions and ports of the RTP proxy or media server, NAT, transcoding usage |
Growing share of remote among completed calls |
Session timers, RTP timeouts on the media server, process restarts |
| 503 and 408 under load | Overload protection kicking in, channel pool limits, CPS limiters |
The rule is one: a client-side metric says what and when broke, the server side says why. If both sets live in one Prometheus with a shared testid and pbx_version, a single click shows which PBX resource hit its limit at the moment signaling started to slip on the generator — and the capacity of a new version gets measured not as "holds 30 CAPS" but as "holds 30 CAPS, then hits the SIP stack's CPU".
Server-side monitoring depends heavily on the specific PBX (Asterisk, FreeSWITCH, Kamailio/OpenSIPS, proprietary B2BUA), so here it is only sketched out. If you are building load tests for your own telephony and want to tie generator metrics to server metrics into one dashboard — get in touch, that is exactly what I work on.
Next step
A closed model with a fixed number of VUs checks stability at a known load, but it does not find the ceiling. By Little's law, with a fixed L = 100, growth in W itself lowers λ: if the PBX starts answering INVITE in 2 s instead of 3 ms, the VUs wait longer and CAPS falls — the generator adapts to the SUT's speed. ASR and SEER can stay green at the same time: there are fewer calls, but all of them pass.
The same synchronization distorts times. While a VU waits for a slow call, it does not start the next one, and the calls that would have landed at the worst moment simply never happen and never enter the percentiles. This is coordinated omission: the p99 on the chart is better than what real subscribers would see — subscribers do not wait for each other. On the dashboard it shows up as a dip in CAPS with an unchanged VU count and calls in progress equal to the number of VUs.
Finding capacity requires an open model: ramping-arrival-rate in steps with abort on threshold (abortOnFail). In it CAPS is set by the generator, and when the SUT degrades what grows is not the pause but the number of concurrent calls (L = λW) — until preAllocatedVUs run out (dropped iterations) or the PBX's channels do. It is exactly in such a run that the panels left empty here will fire: failure codes, first response at T1, retransmissions, drops in SEER and ALOC.