
How to set up load testing from scratch and wire it into CI, using xk6-sip — an extension for the k6 load tool aimed at VoIP/SIP telephony — as the example. On every push, GitHub Actions runs six functional call scenarios and a two-minute load run with quality thresholds, and the run page gets a summary: every scenario and every step, key load metrics against the thresholds. The artifacts keep the JUnit reports, WAVs from failed audio checks, and a Grafana dashboard screenshot for the test window.
Describing calls as code and the internals of the xk6-sip engine, plus load monitoring on Prometheus and Grafana, were covered earlier. This article combines them into a CI pipeline on GitHub Actions that checks the PBX on every commit.
For VoIP/SIP telephony, test automation in CI has historically been hard. Classic SIPp describes scenarios in XML and exports neither Prometheus metrics nor a JUnit report, so in a pipeline it has to be wrapped in scripts. In xk6-sip a scenario is an ordinary k6 script, while thresholds, JUnit, and metric export are standard k6 features.
Load testing often lives apart from development: once per release an engineer runs it by hand, looks at the graphs, and writes a report. Degradation then surfaces weeks after the commit that caused it. Automating load testing in CI shrinks that window to minutes: performance thresholds become quality gates, like unit tests.
Everything below comes from the real pipeline of the xk6-sip repository: functional tests take 40 seconds, load with monitoring 3.5 minutes, 401 calls and 2,005 checks per run.
In this article:
- Pipeline architecture: what runs on the runner.
- Setting up load testing from scratch: three levels of checks.
- Functional call tests on every push.
- The load run in CI and thresholds as quality gates.
- Reports: run summary on the GitHub page, JUnit, and the dashboard for the run window.
- Pitfalls along the way.
- What comes next: a real PBX, scheduled CI runs, and baseline comparison.
Pipeline architecture
On every push and pull request, alongside unit tests, build, and linter, two jobs with calls run in parallel on ordinary GitHub Actions runners, with no external test stands: everything — both the PBX under test and the monitoring — comes up on the runner itself and disappears with it.
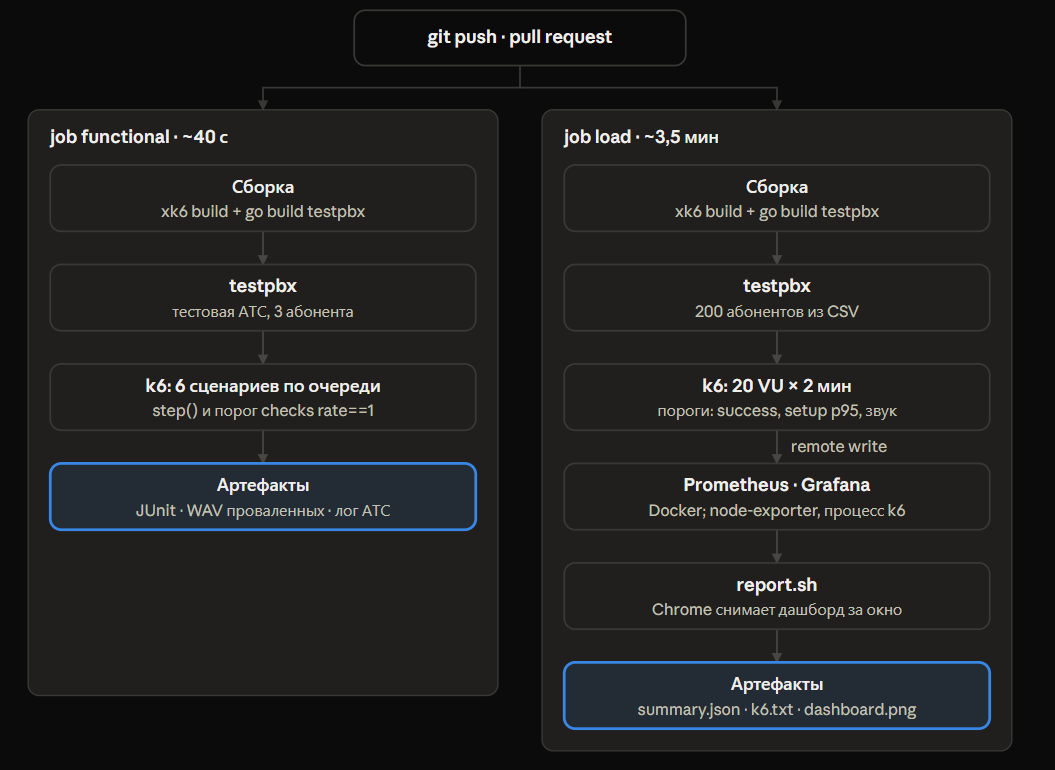
The build result is decided by k6 exit codes: a failed check or threshold turns the job red, and artifacts are saved either way.
Setting up load testing from scratch
Load testing in CI is not one big run but three levels of checks with different frequency and cost. The more expensive the check, the less often it runs.
| Level | When | Duration | What it catches |
|---|---|---|---|
| Functional call scenarios | every push and PR | seconds | broken call flows: hold, transfers, rejections, audio |
| Short load run (smoke-performance) | every push and PR | minutes | coarse degradation, leaks, signaling and media desync |
| Full load: limit finding, stability | on a schedule or before a release | hours | the CAPS ceiling, degradation between PBX versions |
The first two levels live in ordinary CI on shared runners. The third needs a dedicated generator and lab, and that comes at the end. To get started you need four things:
- A load generator that builds and runs with a single command. Here that is k6 with the xk6-sip extension:
xk6 buildproduces one binary with no external dependencies. - The system under test inside CI. For the extension that is the test PBX testpbx: a registrar and B2BUA in Go with digest auth, hold, and transfers. For a real PBX — its lab or a container (Asterisk, FreeSWITCH).
- Thresholds in the script. k6 checks them itself and exits non-zero when a threshold is breached. That is the quality gate: no separate check on top of it is needed.
- Monitoring and reporting. Prometheus and Grafana in Docker right on the runner, plus a script that captures the dashboard for the test window after the run. Without a report, a red build says "it got worse" but not what and when.
Functional call tests on every push
Six scenarios run in 40 seconds and cover the main call flows of a PBX. Each is one VU and one iteration, because what is checked here is logic, not volume.
| Scenario | What it checks |
|---|---|
basic-call.js |
the call, ringback, answer, audio in both directions, DTMF, who hung up |
hold.js |
hold and the re-INVITE return: audio disappears and comes back |
blind-transfer.js |
blind REFER transfer |
attended-transfer.js |
attended transfer with Replaces |
audio-quality.js |
each side clearly hears the peer's phrase and does not hear itself |
reject-cancel.js |
rejection (486), cancel during ringing (487), nonexistent number (404) |
A scenario is an ordinary k6 script that reads like a test case. Here are rejection and cancel in full:
export default function () {
  // B is busy
  let out = step('A calls B', A.call({ callee: B }));
  let inc = step('B gets the call', B.expectCall({ caller: A, timeout: '10s' }));
  inc.reject(486, 'Busy Here');
  step('A: busy call ended', out.expectDisconnected('10s'));
  step(`A gets 486 (got ${out.status()})`, out.status() === 486);

  // A hangs up while B is still ringing
  out = step('A calls B again', A.call({ callee: B }));
  inc = step('B gets the second call', B.expectCall({ caller: A, timeout: '10s' }));
  step('A hears ringing', out.expectRinging('10s'));
  out.hangup();
  step('B: call cancelled', inc.expectDisconnected('10s'));
  step(`B: ended with 487 (got ${inc.status()})`, inc.status() === 487);

  // the number does not exist
  out = step('A calls 1999', A.call({ callee: '1999' }));
  step('A: call to unknown number ended', out.expectDisconnected('10s'));
  step(`A gets 404 (got ${out.status()})`, out.status() === 404);
}
Three principles this rests on:
step()stops the scenario at the first failure. If B did not get the call, checking the status is pointless, and the report shows one real cause instead of a cascade of secondary errors.- The actual value lives in the check name. In JUnit and in the k6 output you see "A gets 404 (got 480)", and there is no need to open the log.
- The threshold
checks: ['rate==1']turns any failed check into a k6 failure with a non-zero exit code, andhandleSummary()writes the JUnit report for CI.
The GitHub Actions job builds k6 and testpbx, starts the PBX, and runs the scenarios in turn. One failed scenario does not stop the rest: at the end you see everything that is broken at once.
  functional:
    runs-on: ubuntu-latest
    steps:
      - uses: actions/checkout@v7
      - uses: actions/setup-go@v7
        with:
          go-version: stable
      - name: build k6 and testpbx
        run: |
          go install go.k6.io/xk6@latest
          mkdir -p bin
          xk6 build v2.3.0 --with github.com/Dmitry-Fedotov-Dev/xk6-sip=. --output bin/k6
          go build -o bin/testpbx ./cmd/testpbx
      - name: run scenarios
        run: |
          ./bin/testpbx -addr 127.0.0.1:5070 -users 3 > testpbx.log 2>&1 &
          sleep 1
          mkdir -p reports
          cd examples/functional
          failed=0
          for s in basic-call hold blind-transfer attended-transfer audio-quality reject-cancel; do
            echo "::group::$s"
            if ! ../../bin/k6 run -q -e JUNIT="../../reports/$s.xml" -e RECORD_DIR=../../reports/recordings "$s.js"; then
              echo "::error title=functional::$s failed"
              failed=1
            fi
            echo "::endgroup::"
          done
          exit $failed
      - name: keep reports
        if: always()
        uses: actions/upload-artifact@v7
        with:
          name: functional-reports
          path: |
            reports/
            testpbx.log
The artifacts keep the JUnit report per scenario, the PBX log, and WAV recordings of the calls where the audio check failed: you can listen to them.
The load run in CI
Every push runs a two-minute load test: 20 virtual users, each driving a pair of subscribers and calling in a loop with 5–6 seconds of talk. The profile is deliberately small: the job of this level is to catch coarse degradation and desync, not to find the ceiling.
Every call is checked end to end: B receives the call with the correct caller ID, the connection is established, audio flows, B hears A's phrase without distortion (compareAudio()), the call ends. Above that sit the thresholds that decide the build's fate:
export const options = {
  scenarios: { calls: { executor: 'constant-vus', vus: 20, duration: '2m' } },
  thresholds: {
    sip_call_success: ['rate>0.99'],       // calls connect
    sip_call_setup_time: ['p(95)<500'],    // and quickly
    rtp_audio_heard: ['rate>0.99'],        // no one-way audio
    rtp_audio_score: ['p(95)>0.9'],        // and no distortion
  },
};
Results of the latest run on a shared GitHub Actions runner:
| Metric | Value | Threshold |
|---|---|---|
| Calls | 401, averaging 3.15 CAPS | — |
| Successful | 100% | > 99% |
| Setup time p95 | 1.05 ms | < 500 ms |
| Post-dial delay p95 | 0.90 ms | — |
| First INVITE response p95 | 0.35 ms | — |
| Jitter p95 | 0.52 ms | — |
| RTP packets received / lost | 224,107 / 0 | — |
| Audio score p95 | 0.993 | > 0.9 |
| Checks | 2,005 of 2,005 | — |
A cross-check with Little's law L = λW: 20 VUs, and one iteration is call setup, 5.6 s of talk, and 0.5 s of pause — about 6.3 s. That gives 20 / 6.3 ≈ 3.2 CAPS against the measured 3.15: the generator delivered exactly the load that was requested.
Why the setup time threshold is 500 ms when the actual figure is 1 ms. Shared CI runners have noisy neighbors: the VM shares its CPU with other builds, and timings swing by factors. A threshold at the level of the SIP T1 timer, 500 ms, catches a real break (the PBX answers so slowly that the client is already retransmitting) and does not turn red on random spikes. Precise millisecond comparisons belong on a dedicated lab. The rule: on shared runners, thresholds check correctness and coarse degradation, not exact numbers.
The load job has three steps: start monitoring and the PBX, run k6, take the report:
      - name: start monitoring and the test PBX
        run: |
          docker compose -f monitoring/docker-compose.yml --profile linux-host up -d
          ./bin/testpbx -addr 127.0.0.1:5070 -users 200 -csv examples/subscribers.csv > reports/testpbx.log 2>&1 &
          timeout 60 bash -c 'until curl -sf http://localhost:3001/api/health >/dev/null; do sleep 2; done'
      - name: load test
        env:
          K6_PROMETHEUS_RW_SERVER_URL: http://localhost:9091/api/v1/write
          K6_FEATURES: native-histograms
        run: |
          echo "START=$(date +%s)" >> "$GITHUB_ENV"
          ./bin/k6 run -o experimental-prometheus-rw --tag testid="$TESTID" --tag pbx_version=testpbx \
            -e VUS=20 -e DURATION=2m -e HOLD=5 -e AUDIO=1 -e SIP_METRICS_ADDR=0.0.0.0:6566 \
            --summary-export reports/summary.json examples/call.js | tee reports/k6.txt
      - name: dashboard report
        if: always()
        run: |
          sleep 15 # the last remote write and scrape
          bash monitoring/report.sh "$TESTID" $((START - 30)) $(($(date +%s) - 10)) reports/dashboard.png
TESTID equals ci-<build number>: by it the run is found on the dashboard, and if the monitoring is shared between several builds, runs do not mix. k6 exports its test metrics via remote write, while Prometheus collects the k6 process and machine metrics itself; how this is set up is covered in detail in the load monitoring article.
Reports: run summary, JUnit, and the dashboard
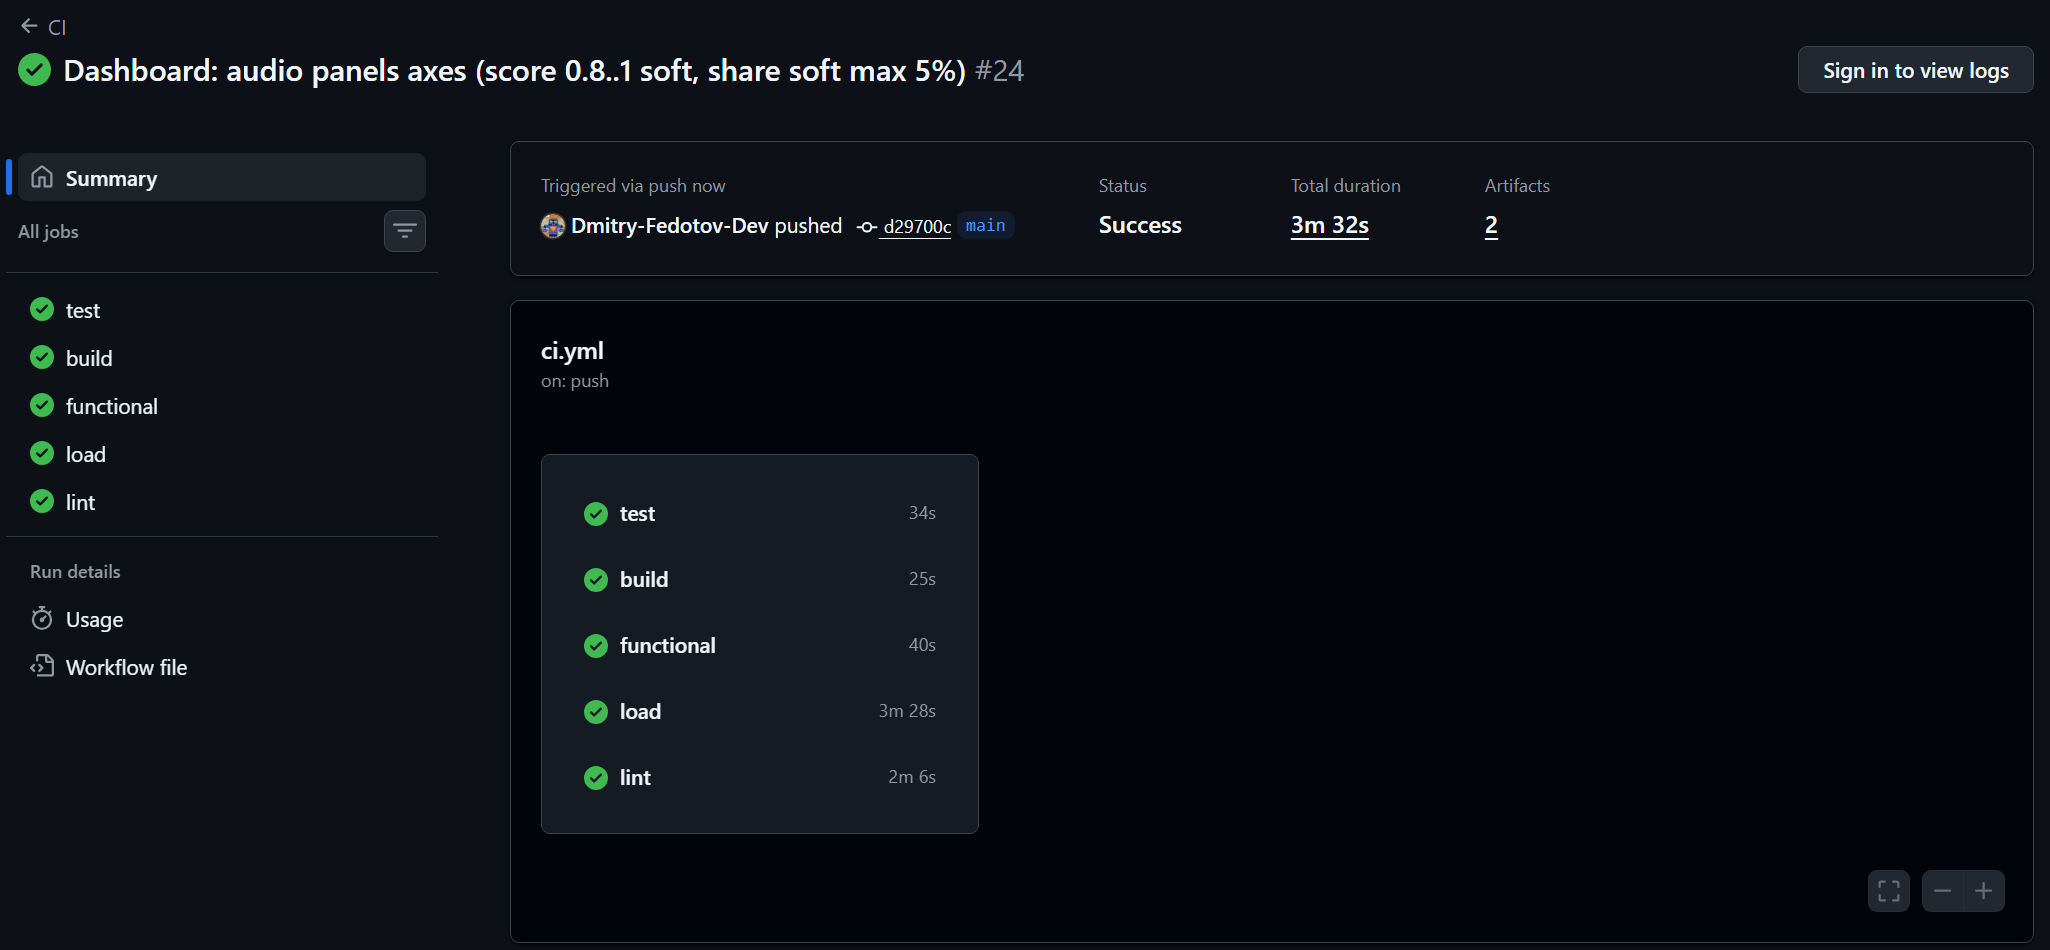
This is what a green run looks like in GitHub Actions: five jobs in 3.5 minutes, the load one the longest. Reports live in two build artifacts: functional-reports and load-report.
Summary on the run page
The first thing you see after a build is not the artifacts but the summary right on the run page. Downloading a zip to learn "what failed" is an extra step, and nobody takes it. GitHub Actions provides the $GITHUB_STEP_SUMMARY file for this: whatever the job writes there in Markdown shows up on the Summary tab.
Both call jobs end with a summary step under if: always(): it runs on a red build too, when the summary matters most. A short dependency-free Python script, .github/scripts/summary.py, assembles it from what k6 has already written: the scenario JUnit reports and the load summary.json.
Functional tests — one row per scenario: result, step count, and the failed step.
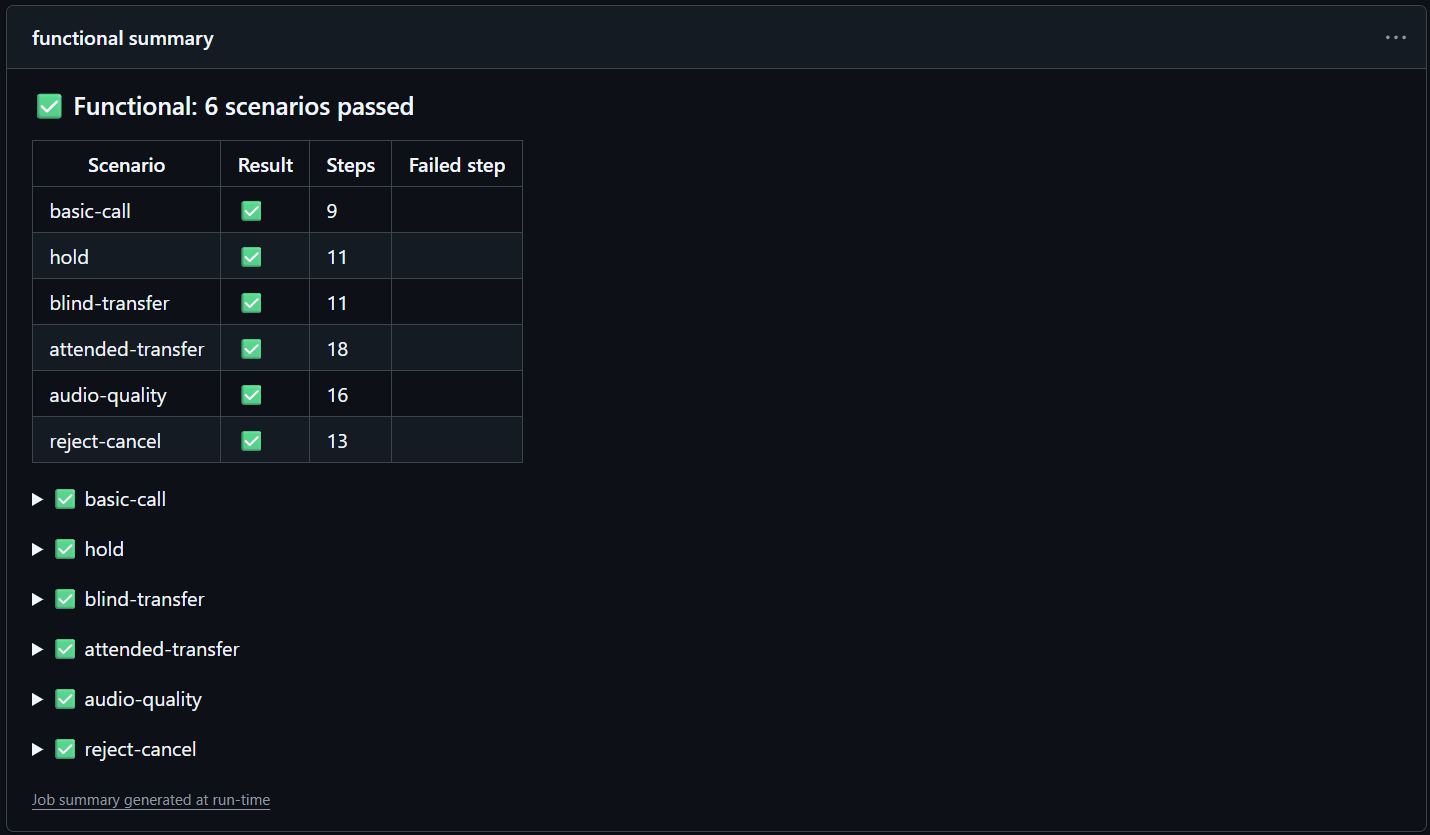
Under the table, each scenario's steps sit in collapsed <details> blocks. For a passing scenario the block stays collapsed; for a failed one it is expanded right away and shows what passed before the break and where exactly it broke. Here is what the summary looks like if the audio score threshold is cranked up to 0.999 (script output from a real failure):
| Scenario | Result | Steps | Failed step |
|---|---|---|---|
| basic-call | ✅ | 9 | |
| audio-quality | ❌ | 6 of 7 passed | B hears A's phrase clearly (score 0.993 >= 0.999) |
| Step | |
|---|---|
| ✅ | A calls B |
| ✅ | B gets the call from A |
| ✅ | A connected |
| ✅ | B hears A |
| ✅ | A hears B |
| ✅ | B audio compared |
| ❌ | B hears A's phrase clearly (score 0.993 >= 0.999) |
| ❌ | threshold checks: rate==1 |
The call connected, audio flows in both directions, and A's phrase arrived with a score of 0.993 against a requirement of 0.999. All of this is visible without the log and without artifacts. The job log prints the same summary, but with steps only for failed scenarios, so it does not drown in green rows.
The step in the functional job is three lines:
      - name: summary
        if: always()
        run: |
          python3 .github/scripts/summary.py functional reports $SCENARIOS
          python3 .github/scripts/summary.py functional --all-steps reports $SCENARIOS > reports/summary.md
          cat reports/summary.md >> "$GITHUB_STEP_SUMMARY"
The first line prints the short summary to the log, the second saves the full one to an artifact, the third puts it on the run page.
Load. Here the summary answers two questions at once: whether the thresholds passed, and how far the metrics sit from them. The script takes numbers from summary.json, which k6 writes with the --summary-export flag, and puts each metric's threshold from the script next to it. The header is the verdict in one line: "✅ Load: 4 thresholds passed" or "❌ Load: 1 of 4 thresholds crossed".
The table has two kinds of rows:
- With a threshold — the build's quality gate: successful calls, setup time p95, the share of legs that heard audio, audio score p95. A ✅ or ❌ sits next to it.
- Without a threshold — context that explains a red row: number of calls and CAPS, post-dial delay, first INVITE response, jitter, RTP packets received and lost, checks. If the audio score threshold failed, the "RTP packets received / lost" row immediately shows whether it was packet loss or something else.
Here is how the summary looks on the latest run:
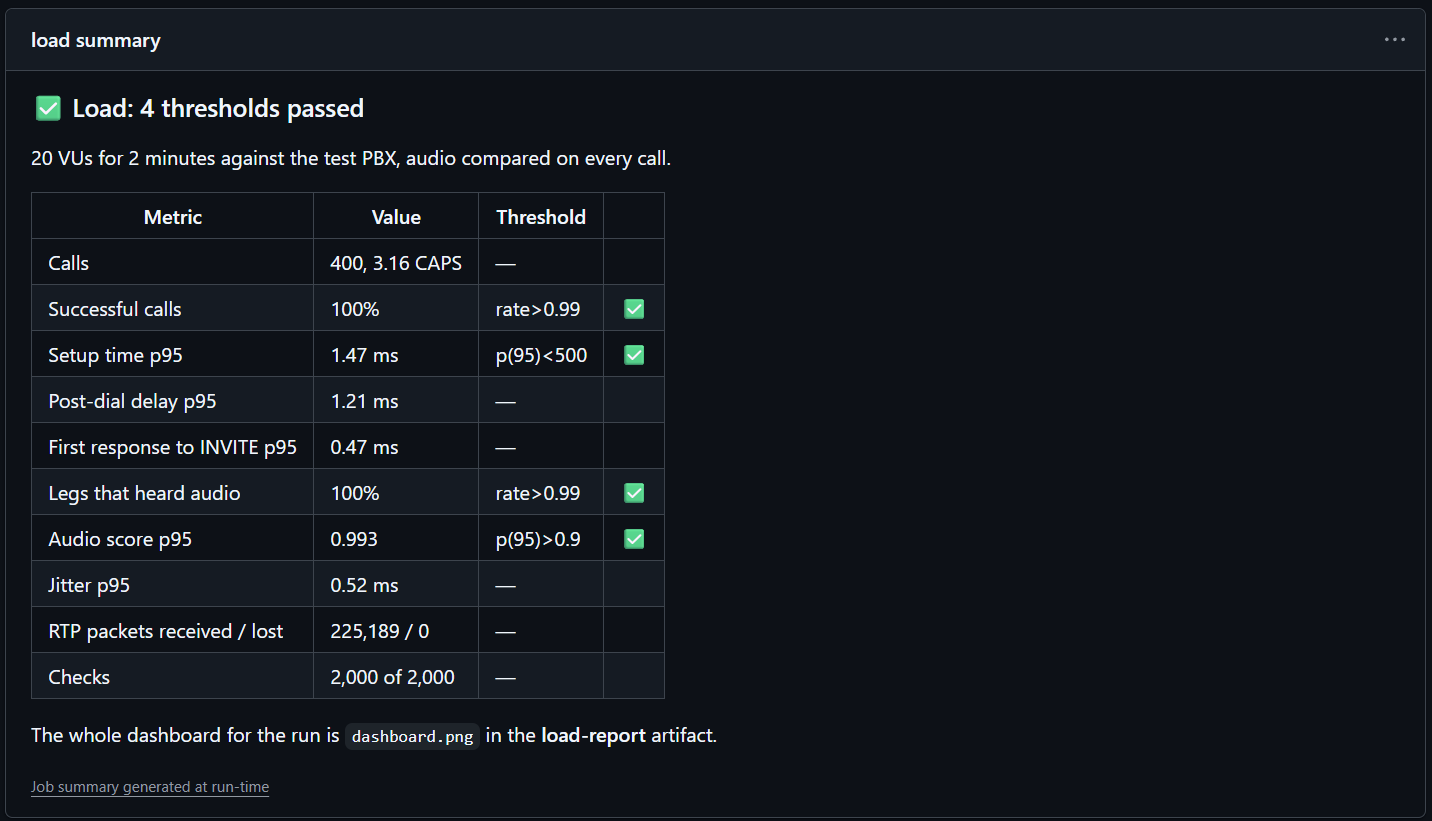
The first row is also a check on the test itself: 3.18 CAPS matches the Little's law calculation of 3.2, so the generator delivered the requested load. If the shared runner had choked, CAPS would drop before any threshold turned red. Any threshold that is missing from the metric list gets added as its own row by the script: a crossed threshold cannot be lost, even if it was added later. The last row of the summary points at dashboard.png in the artifact: the summary says "what", the dashboard says "when and how".
The step in the load job is the same, with a check that k6 managed to write its summary at all:
      - name: summary
        if: always()
        run: |
          if [ -f reports/summary.json ]; then
            python3 .github/scripts/summary.py load reports/summary.json \
              "20 VUs for 2 minutes against the test PBX, audio compared on every call." > reports/summary.md
            cat reports/summary.md
            cat reports/summary.md >> "$GITHUB_STEP_SUMMARY"
          fi
JUnit: what it's doing here
JUnit XML is a test report format that almost any CI and test management system understands. The name stayed from the Java framework, but the format itself has long been general: a test suite (testsuite), test cases inside it (testcase), and a failure with a reason for the one that failed. The script builds the functional summary from JUnit, and that is exactly what other systems pick up if your CI isn't GitHub.
In this report, each step() of a scenario is its own test case, with the actual value in the name:
<testsuite name="reject-cancel" tests="14" failures="0">
  <testcase name="A calls B" classname="reject-cancel"/>
  <testcase name="B gets the call" classname="reject-cancel"/>
  <testcase name="A gets 486 (got 486)" classname="reject-cancel"/>
  ...
  <testcase name="A gets 404 (got 404)" classname="reject-cancel"/>
  <testcase name="threshold checks: rate==1" classname="reject-cancel"/>
</testsuite>
The trap in the standard function. In the first version, handleSummary() called jUnit() from the official k6-summary library, and the reports looked like this:
<testsuite name="k6 thresholds" tests="1" failures="0">
  <testcase name="checks - rate==1" classname="Unnamed folder" />
</testsuite>
One case for the whole scenario: jUnit() builds test cases from thresholds, not from checks. Had such a report failed, it would have said only "something is wrong". This went unnoticed at first: while everything is green, nobody opens the file. Now lib.js writes the JUnit itself, in about 30 lines: it walks data.root_group.checks from the k6 summary in execution order and adds one case per threshold.
Who else can display this report. The summary is the GitHub-specific version. Other systems read the same XML themselves, and every call step there becomes its own test:
| Where | How it shows it | What you need |
|---|---|---|
| GitLab CI | the Tests tab in the pipeline and a widget in the merge request | artifacts: reports: junit: reports/*.xml |
| Jenkins | per-case history across builds, a passed/failed chart | the JUnit plugin: junit 'reports/*.xml' |
| GitHub, with annotations in the PR | failed steps as a separate check report | a third-party action (dorny/test-reporter and similar) |
| TestRail, Xray, Zephyr | the run in a test management system | JUnit XML import |
That is exactly why the actual value belongs in the step name. GitLab or TestRail will have no k6 log, and the line "A gets 404 (got 480)" explains the failure on its own.
The dashboard for the run window
Thresholds answer "did it pass"; the dashboard answers "what happened". But Prometheus and Grafana on the runner vanish with it, so the dashboard has to be saved in time. That is what the script monitoring/report.sh does: it opens the dashboard in headless Chrome with the right testid and time window and captures the whole thing as a single image.
# page height from the dashboard markup: Grafana grid cell 30 px + 8 px padding
height=$(python3 -c 'import json,sys
d = json.load(open(sys.argv[1], encoding="utf-8"))
print(max(p["gridPos"]["y"] + p["gridPos"]["h"] for p in d["panels"]) * 38 + 80)' "$dashboard")

# kiosk — no menus; testid and from/to (in milliseconds) select the run and its window
url="$grafana/d/xk6-sip/xk6-sip?orgId=1&kiosk&var-testid=$testid&var-window=30s&from=${from}000&to=${to}000"

# --window-size: a window as tall as the whole dashboard — Grafana draws only visible panels
# --run-all-compositor-stages-before-draw: capture only a fully rendered page
# --virtual-time-budget=60000: up to 60 s of virtual time for Prometheus requests;
#   without it Chrome captures right after load, and the panels come out empty
"$chrome" --headless=new --disable-gpu --hide-scrollbars --window-size="1600,$height" \
  --run-all-compositor-stages-before-draw --virtual-time-budget=60000 \
  --screenshot="$out" "$url"
Two details without which the screenshot comes out empty. Grafana draws panels lazily, only in the visible part of the window, so the browser window has to be as tall as the whole dashboard. And --virtual-time-budget gives Prometheus requests time to finish before the capture. The time window runs from 30 seconds before the k6 start to the end of the run, with a 15-second pause for the last metric write.
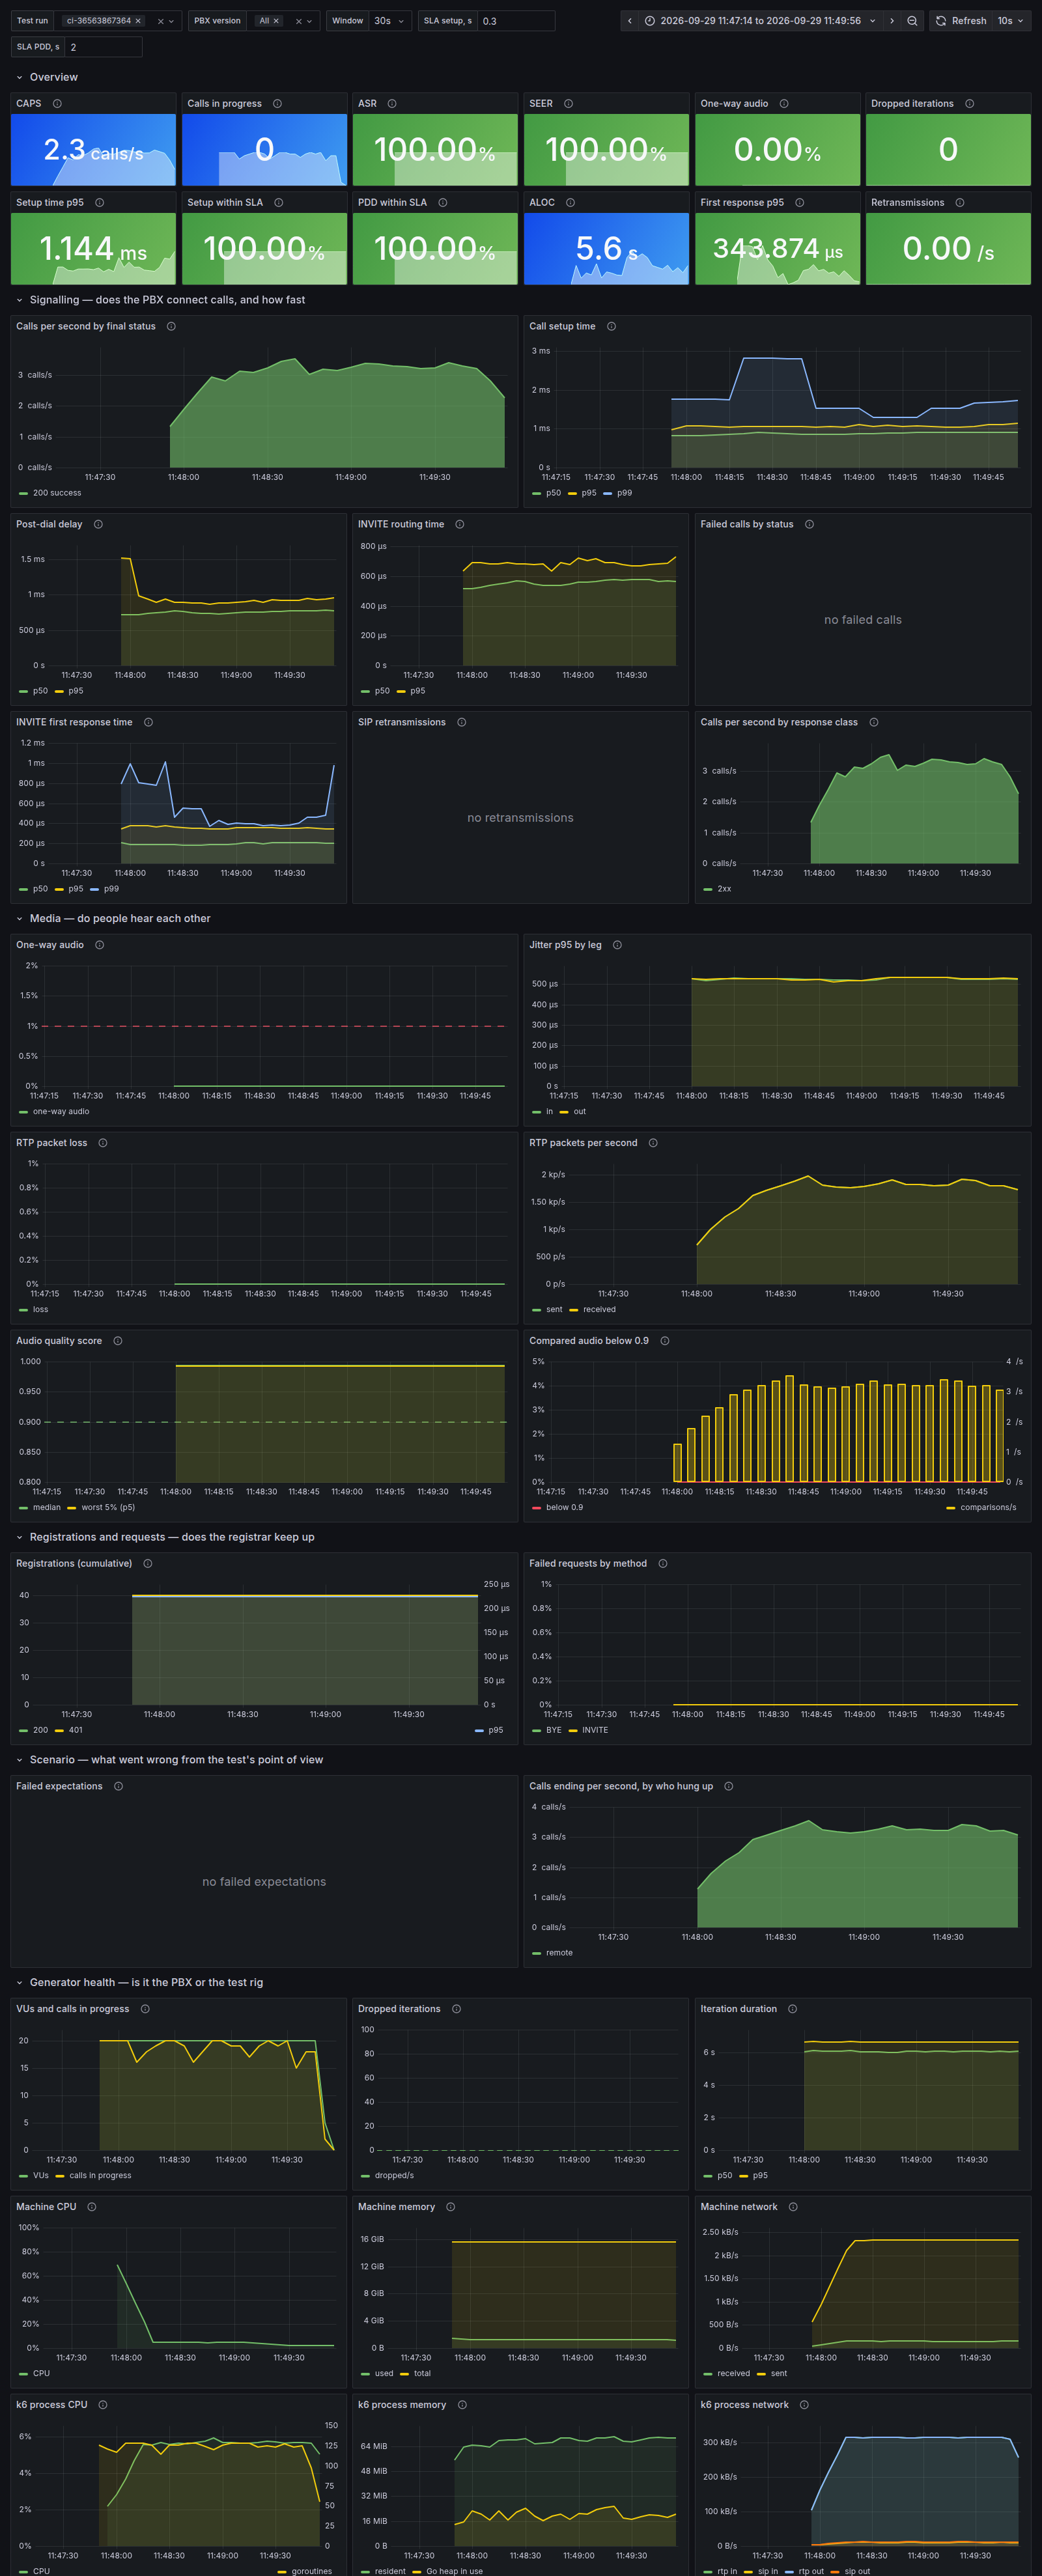
The result is a 1600 × 3956 image with all 39 panels, in the build artifacts. Two blocks from it, in detail.
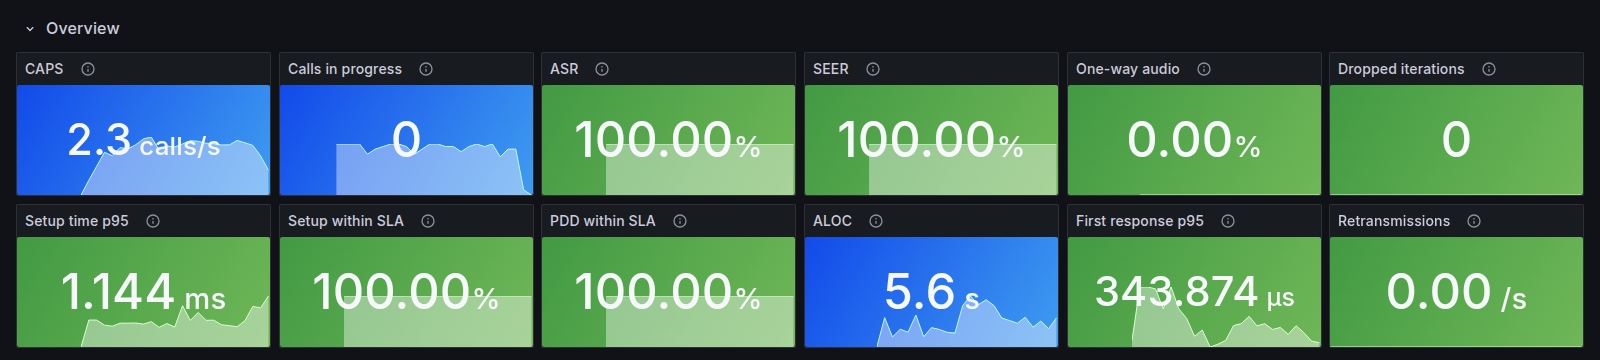
The top block is 12 gauges for the last window: ASR and SEER at 100%, one-way audio 0%, setup p95 1.1 ms, all calls within SLA, no retransmissions. "Calls in progress 0" and CAPS 2.3 instead of 3.15 are not an error: the tiles show the freshest data point, and it lands at the end of the test. Whole-run averages are in the k6 output.
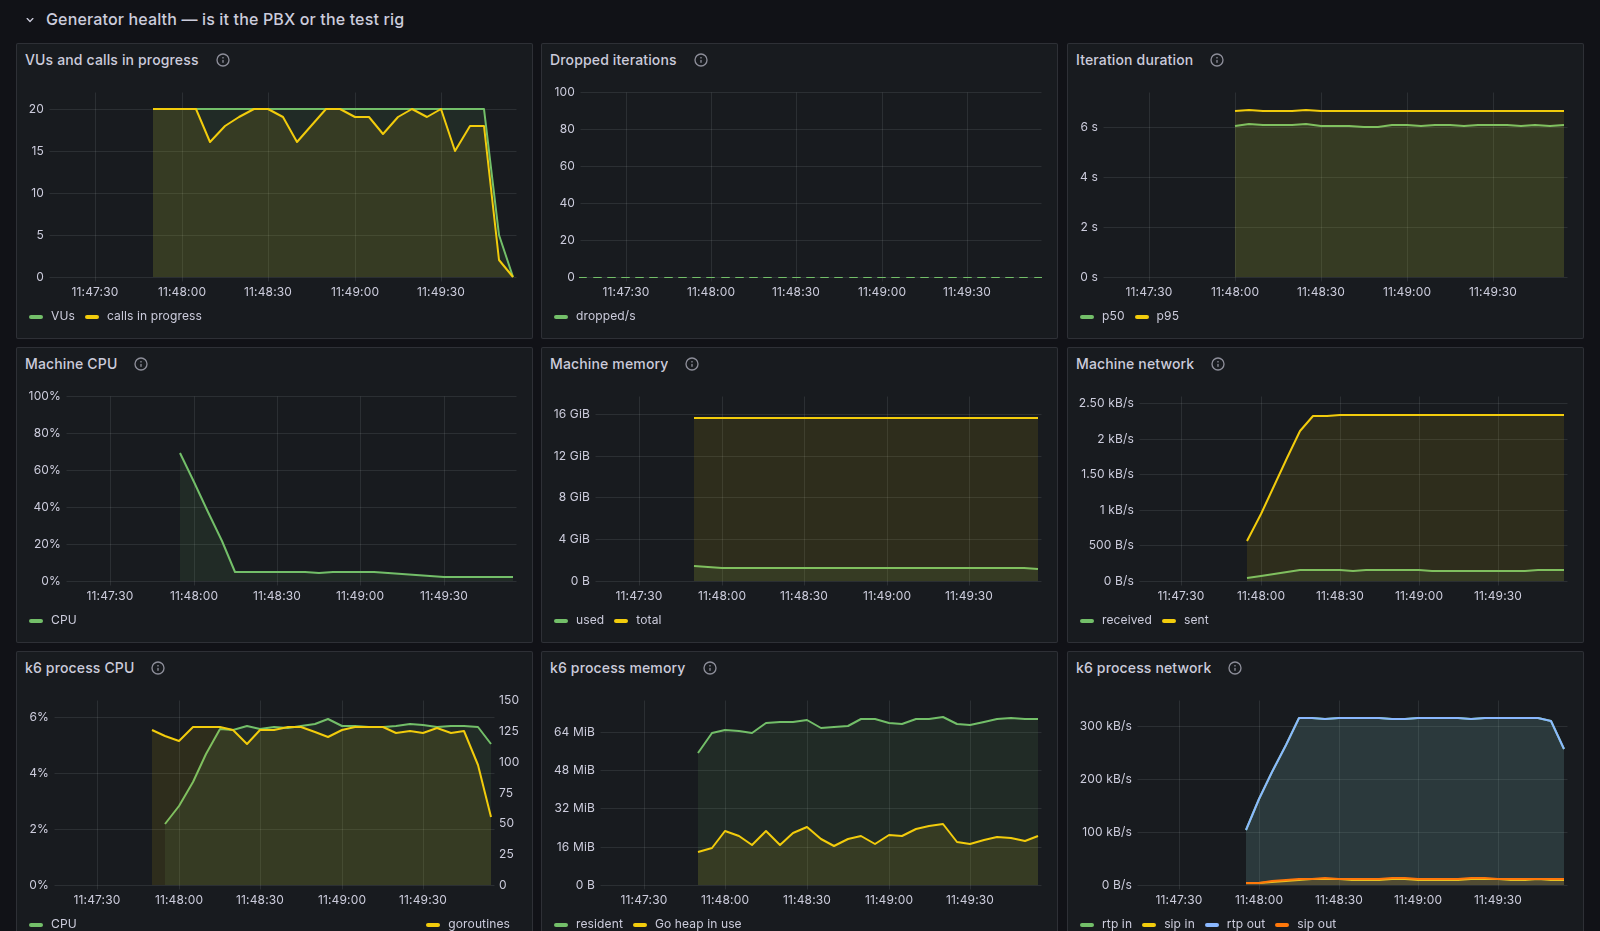
The bottom block answers the main question of load testing on a shared runner: did the test itself hit a wall. Dropped iterations — 0, and iteration duration is flat at 6–6.5 s. The k6 process used about 6% of one core and 70 MB of memory, the Go heap oscillates without growth, goroutines around 125. Machine CPU after startup sits at a few percent; the spike to 70% at the start is containers and k6 starting up. So the signaling and audio numbers can be trusted.
The machine's network meanwhile shows kilobytes, while the k6 process shows 310 kB/s of RTP. The test PBX runs on the same machine, and calls go over loopback, which never crosses the network card. The socket counters in xk6-sip see it; the machine exporter does not.
And in full, this is what the report looks like in the build artifacts:
Pitfalls
Setup took six CI runs. Not a single failure was in the tests themselves — all of them were in the environment around them.
| Symptom | Cause | Fix |
|---|---|---|
All six scenarios fail: no answer to REGISTER, 10 retransmissions, Timer_B timed out |
go build -o testpbx put the binary inside the testpbx/ folder — that is the PBX package name in the repository. ./testpbx & silently failed to start, and there was no PBX at all |
binaries in bin/ |
open bin/k6: no such file or directory |
bin/ is in .gitignore, a clean runner does not have it, and xk6 does not create the folder itself |
mkdir -p bin |
monitoring/report.sh: Permission denied |
the script was committed from Windows without the executable bit | git update-index --chmod=+x and invoking it through bash |
| k6 process panels empty on Linux although they work on Windows | Prometheus in Docker reaches k6 through the host gateway, and an endpoint on 127.0.0.1 is not visible from there. Docker Desktop on Windows hides this |
SIP_METRICS_ADDR=0.0.0.0:6566 on the runner |
| error-rate panel with an axis up to 10,000% | when all values are zero, Grafana picks the axis range itself | a soft axis maximum (axisSoftMax) |
The first row is the most instructive one. The symptoms looked like a network problem or a SIP stack error, while the cause turned up in the first line of the PBX log, which the pipeline saves to artifacts: ./testpbx: Is a directory. The rule: ship logs of the system under test into artifacts with if: always() from day one. It also pays to check that the system actually started before loading it: for Grafana this is already done through /api/health, for the PBX there is still just a sleep 1.
One more subtlety concerns metrics rather than CI: Prometheus native histograms distort values that pile up near one. An audio score of 0.993 turned into 0.958 on the dashboard. The audio quality article covers this in detail.
What comes next
What is described above covers the first two levels of checks. Next comes what turns a CI with load into a full load testing process:
- A real PBX instead of the test one. The scenarios do not change: subscribers are passed via
-e REGISTRAR=... -e A_USER=...or CSV. The PBX can be brought up as a container right in CI (Asterisk, FreeSWITCH), or the tests can run against a lab over a self-hosted runner on its network. - Long scheduled runs. A nightly job (
on: schedule) on a dedicated generator: limit finding with an open workload model (ramping-arrival-ratestepped up in stages) and soak tests measured in hours. The closed model with a fixed number of VUs, as in CI, does not find the ceiling: when the PBX slows down, it lowers CAPS itself. - Baseline comparison. Right now the thresholds are absolute. The next step is comparing
summary.jsonagainst a main-branch run and failing the PR when setup p95 or the audio score degrade beyond tolerance. On a dedicated lab with a persistent Prometheus, a dashboard does the same: pick severalpbx_versionvalues and compare versions on one chart. - Results right in the PR. A comment with a table of key metrics and a report preview, so the reviewer sees the change's performance impact without downloading artifacts.
Everything described here lives in the repository github.com/Dmitry-Fedotov-Dev/xk6-sip:
- the CI workflow,
- the functional scenarios,
- the report script and the Grafana dashboard.
If you test your own PBX — Asterisk, FreeSWITCH, Kamailio, OpenSIPS, or one you wrote yourself — try these scenarios on it: to get started, two subscribers and a registrar address are enough. Results, failures, and missing scenarios are welcome in the repository's issues. And if the approach is useful, star the repository on GitHub: it helps the tool reach the people who need it.